First presented at GPD 2017
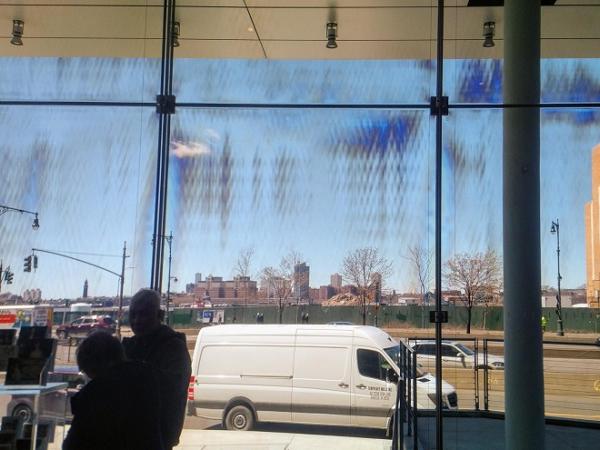
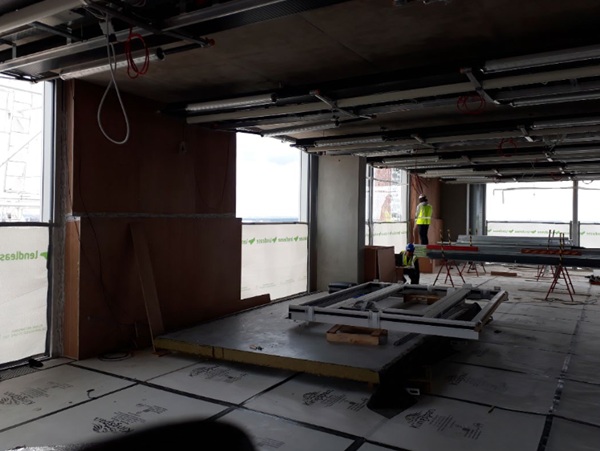
This invariably produces HACI. All these phenomena are observable, but deemed inevitable, physical properties and inherent to manufacturing.
We want to offer higher quality products and believe that we can improve those aspects. However, there are no instruments on the market to qualify and quantify HACI on large pieces of glass. We believe that a numerical, repeatable value is the base that will allow improvement in our process.
We launched a research program in conjunction with McMaster University to develop such an instrument. We will share our field observations and early experiments to detect and quantify these phenomena. This remains a work in progress. We see the GPD attendees as the ideal network of professionals to help us align our R&D with industry needs. Our goal is to establish a numerical model that will reflect the severity of the different HACI factors.


What are we talking about?
Anisotropy
Anisotropic material exhibits properties with different values when measured in different directions. The opposite behaviour is isotropy; vacuum and annealed glass are isotropic. Tempering glass creates heterogenous stresses that cause birefringence, an optical property having a refractive index that depends on the polarization and propagation direction of light. These optical patterns become noticeable when polarized light is transmitted or reflected on the glass.
Haze
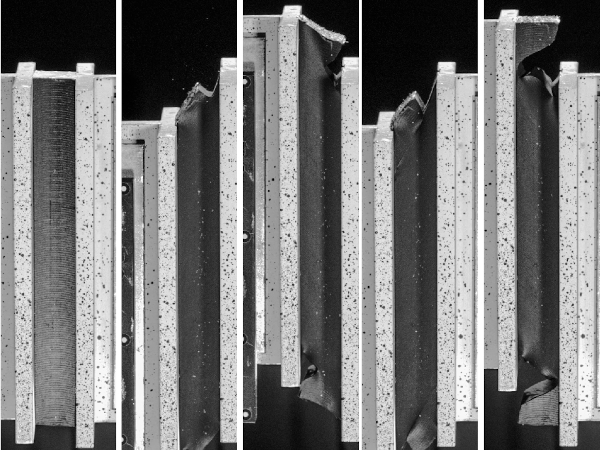
Haze is more simply the scattering of light that creates a reduction in contrast of objects viewed through it. Haze is quantifiable. ASTM defines it as the percentage of transmitted light that is scattered so that its direction deviates more than a 2.5° angle from the direction of the incident beam (ASTM International, 2000). Coatings and ionoplast interlayers can create haze when crystalline structures build up in them. Haze is also pervasive in switchable privacy films.
Clarity
Clarity is similar to haze, but pertains to scattering with a smaller angle.
Interference
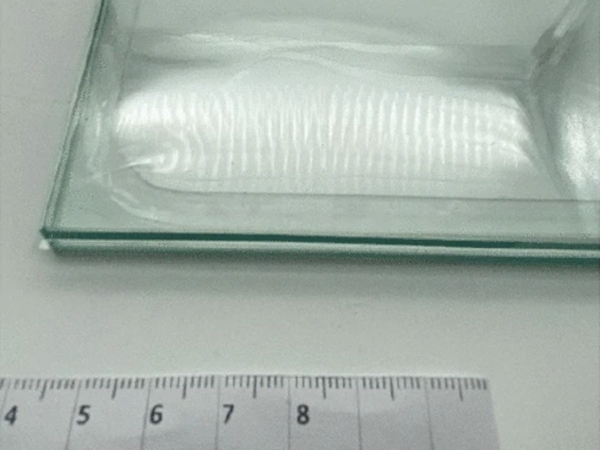
Interference fringes exist in insulating glass units and under sacrificial lites. They are the result of an interaction between colliding light waves. Because of reflections off the multiple glass surfaces, light waves divide and travel different paths, then recombine. When they recombine, interference fringes may be seen (PPG Industries, Inc., 2002).
Regulation and standards
An exhaustive study of European and British standards and industry guidelines was presented at GPD 2015. “Anisotropy is clearly recognized as an inevitable effect of the heat treatment processes by current British Standards” (Pasetto, 2014). The same wording exists in North American standards C 1048. However, the Glass Association of North America (GANA) takes a more utilitarian approach than its European counterpart by suggesting the use of full size mock-ups viewed on-site to determine acceptable anisotropy levels (GANA, 2008).
Stakeholders’ opinion
Savario Pasetto exposed the results of a survey aimed at identifying the extent to which anisotropy is perceived as a defect and how it affects the façade industry in the same GPD presentation (Pasetto, 2014). The quality of the respondents and their distribution in all appropriate domains - Façade consultants, Façade contractors, Architects, Glass suppliers – make this survey relevant despite its small sample size (35).
Apparently, the results show, the results show that most participants are aware of the phenomenon and would like to mitigate it. We think that the current state of technical capabilities, costs and liability influence the wording and possible standardization. Mr. Pasetto rightly note that “the development of anisotropy equipment is critical to analyze the stresses and their distribution and in turn optimize oven design” … “the measuring equipment is also fundamental in defining objective acceptance and rejection parameters” (Pasetto, 2014).
Design criteria for our inspection equipment
The randomness of field problems encountered showed that all glass need to be analyzed in their complete area. We already do this in our existing optical and defect scanners. 100% inspection is also the norm in the automotive glass industry. From our first set of experiments, we can say that we need to analyze finished products:
• Individual components do not show all the story
• There is interaction of interference patterns that complexifies the heterogeneity
• Haze and Clarity are predominately caused with ionoplast lamination, thus exist only in complete laminates
• Interference fringes exist only in IGUs
Knowing the sheer size and weight of our products and the difficulty of manipulating them safely, we will have to integrate inspection after a washer. Vertical setup will minimize floor space and simplify logistics. Computation time is paramount, we want rapid Go/No-Go results independent of operator. Needless to say, these results and photos will be associated with individual pieces for traceability and reporting if required by the customer – as we do for HST records, for example.
We do not think we can measure all phenomena with a single setup. We will share all mechanical devices, but detection apparatus will be different. We are analyzing if a single high-intensity polarized light source could be used.
Quantification
We want to develop and promote an industry standard, we don’t want to work alone nor reinvent the wheel.
Anisotropy
University of Applied Sciences Munich (UASM) has proposed a practical method based on a statistical evaluation of complete retardation array. Using p-quantile, they are able to output simple numerical values that look very promising (M. Illguth, 2015). This method was further developed by our session chair, and we are confident that Saint-Gobain Glass will publish more details on their work in enhancing UASM’s method.
Haze
Because we analyze on a large area and we are more interested in heterogeneity, our detection method will be very different from the ASTM D1003 (ASTM International, 2000). However, our objective is to be able to match the absolute value found with the results of the Unidirectional illumination: diffuse viewing method. Percent haze being calculated from the ratio of diffuse, Td, to total luminous transmittance, Tt, as follows:
haze, % =Td / Tt X 100
Interference
We are not aiming at quantifying interference fringes. We think interference will be a byproduct of our experimentation. In correct illumination, that phenomenon should be easily observable. As its origin is purely physical, a feedback loop to design parameters is the only recourse to minimize it.
Conclusion and summary
We are embarking on a very interesting journey that will lead to quantifying phenomena that are deemed inevitable but, in our opinion, can be improved. In the long term, measuring HACI will lead to aesthetic improvements of large and complex glass panels. We believe HACI quantification has the same or even more influence on visual quality and transparency than current small punctual defect detection.
References
ASTM International. (2000). Standard Test Method for Haze and Luminous Transmittance of Transparent Plastics. ASTM D 1003-00.
GANA. (2008). Quench Patterns in Heat-Treated Architectural Glass. GANA TD 05-0108.
M. Illguth, C. S. (2015). The effect of optical anisotropies on building glass façades and its measurement methods. Munich, Germany: ScienceDirect.
Pasetto, S. (2014). Anisotropy as a defect in U.K. architectural float heat-treated glass. Bath, UK: University of Bath.
PPG Industries, Inc. (2002). Interference Fringes in Insulating Glass Units. Pittsburgh, PA: Glass Technical Document TD-118.


