Source: Glass Structures & Engineering
Authors: Dominik Offereins, Alexander Pauli & Geralt Siebert
DOI: https://doi.org/10.1007/s40940-024-00274-z
Abstract
Currently, liquid cold-poured adhesives are infrequently used as interlayers of laminated or laminated safety glass in structural glass applications, despite their inherent benefits. The potential advantages of these materials are characterized by easy handling, rapid curing devoid of elevated temperature or pressure requirements, and consequently, a comparatively low energy demand. Despite the prolonged availability of certain products in the market, comprehensive scientific inquiry into their mechanical and thermal material characteristics remains limited. In this paper, two specific liquid cold-poured interlayer adhesives are investigated for their mechanical material properties in an extensive test regime. To be able to classify the characteristic values of the adhesives within a correct framework, the materials currently holding the largest market share, including Polyvinyl Butyral (PVB), Ionomers, and Ethylene Vinyl Acetate (EVA), are also subjected to the experimental program. The temperature dependence of the material behavior is explored through Dynamic Mechanical Thermal Analysis (DMTA) experiments. Furthermore, the time-dependent material behavior at large deformations is scrutinized using various methodologies, such as tensile tests at different strain rates, cyclic tests, creep tests, and relaxation tests, all conducted in uniaxial tension mode. The outcomes of all tests led to promising results for one of the adhesives with advantages over those of PVB and EVA.
1 Introduction
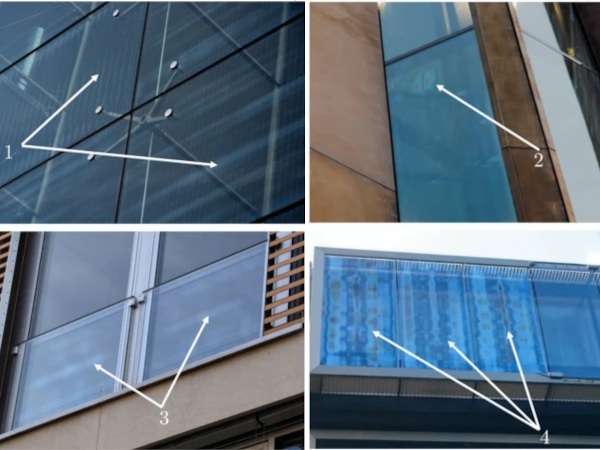
In contemporary times, glass façades no longer solely serve as transparent protection against weather and cold or heat, respectively. Instead, they are becoming increasingly technologically advanced through the integration of screens or photovoltaic systems. As a result, the requirements for the interlayer of laminated glass are also becoming increasingly stringent, necessitated by the seamless integration of such elements.
The interlayer materials employed in laminated glass assemblies generally comprise polymer films, which undergo melting under elevated temperatures and pressure within an autoclave process and thereby establish a cohesive bond with the glass panes. Within the realm of civil engineering, predominant selections include Polyvinyl Butyral (PVB), ionomers (such as SentryGlas®), and Ethylene Vinyl Acetate (EVA). In other sectors such as the automotive and aerospace industries, Thermoplastic Polyurethane (TPU) films find widespread application in windshield manufacturing. Collectively, these products hold a market share in building construction of more than 99% (e.g. Kuntsche 2015).
Other products, some of which have a longstanding presence in the market, can hardly increase their market share and find entry in scientific research despite their potential positive properties. This includes primarily transparent liquid resins, which can be further categorized into one-component (mainly UV-curing) and two- or multi-component curing systems. Such systems require neither high temperatures nor high pressure during the reaction and generally cure quickly compared to an autoclave process, which results in a comparatively low energy demand. The latter has already been investigated in a life cycle assessment study at the University of the Bundeswehr Munich as part of a bachelor’s thesis, revealing a significant CO2 reduction potential through the use of UV-curing interlayers (Hajduk 2024). Another advantage regarding the mechanical properties is that certain liquid adhesives, in contrast to thermoplastics such as PVB, are capable of providing a three-dimensionally crosslinked molecular structure, enabling an equilibrium shear stiffness when loading time approaches infinity. Furthermore, their versatility extends to the facile integration of supplementary components such as photovoltaic elements or displays into the interlayer and the manufacture of mechanically stable cold-bent glass laminates (Wittwer and Schwarz 2013).
In the domain of composite materials, the so-called out-of-autoclave (OOA) process is also being investigated and applied, see e.g. Ekuase et al. (2022). Nevertheless, this method necessitates the application of heat, pressure, and a vacuum, factors which preclude further discussion within this context. For other structural applications in glass construction, partial investigations have been conducted on adhesives for linear [primarily silicones, e.g. Schaaf (2024)] and punctiform steel-glass connections [primarily epoxy resins, e.g. Dispersyn (2016) and Wünsch (2017), and acrylates, e.g. Tasche (2007) and Vogt (2009)].
However, literature specifically addressing the use of liquid adhesives as interlayers for laminated glass remains notably scarce. Excluding studies focused on adhesives for steel-glass connections, the scientific discourse on liquid adhesives as interlayers for laminated glass is primarily encapsulated within publications originating from the manufacturer itself. Notably, Scherer et al. (2017) and Scherer et al. (2021) presented a discussion on liquid cold-poured adhesives, emphasizing their potential for integrating functionalities into façades. Wittwer and Schwarz (2013) provided a material law for glass laminates made with a two-component Polyurethane (PU) resin, focussing on the intact state and therefore small deformations. Using the same product, Volakos et al. (2021a), Volakos et al. (2021b), and Volakos et al. (2023) introduced an innovative bonding technique for laminated glass featuring embedded steel components employing a cold-poured adhesive. However, these publications primarily concentrate on evaluating the pull-out behavior of the steel components rather than delineating the material properties of the interlayer. Hänig (2023), on the other hand, investigated a thin glass-plastic composite with a core of the two-component PU by performing multiple bulk material and composite tests. Otherwise, liquid cold-poured adhesives find application in scientific research in unconventional constructions such as glass masonry arches (Aurik et al. 2018) or tubular glass columns (Veenstra et al. 2022).
These considerations underscore the necessity for further investigation into the realm of liquid cold-poured adhesives, especially at high strains, which serves as the topic of this paper. The main focus is therefore initially on the uniaxial tension stress state. The temperature-dependent behavior of the materials is investigated and compared using Dynamic-Mechanical-Thermal Analysis (DMTA). Furthermore, material tests are conducted in four different specifications: tensile tests up to breakage, cyclic tests, creep tests, and relaxation tests. These tests can be carried out easily, provide detailed information about the general material behavior, and ensure precise comparability with other interlayer materials.
2 Investigated materials
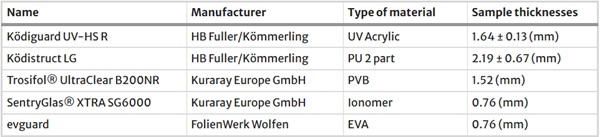
The aim of this paper is twofold: firstly, to examine liquid cold-poured adhesives in detail under uniaxial stress conditions; secondly, to put the results into relation with interlayer films for building industry. To achieve this, two adhesives with different curing mechanisms and an exemplary film representing conventional interlayers were tested. The specific products are listed in Table 1.
Table 1 Investigated interlayer materials - Full size table
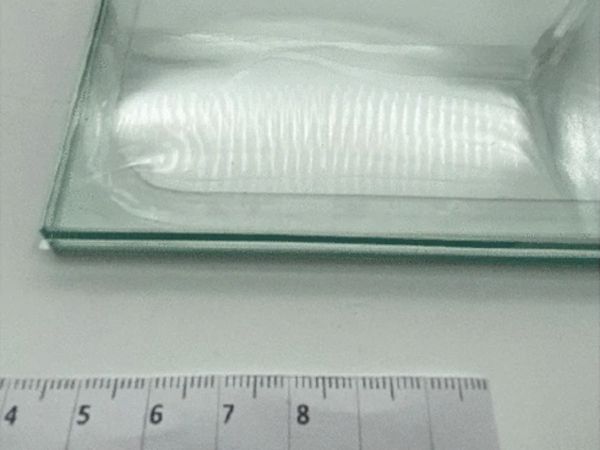
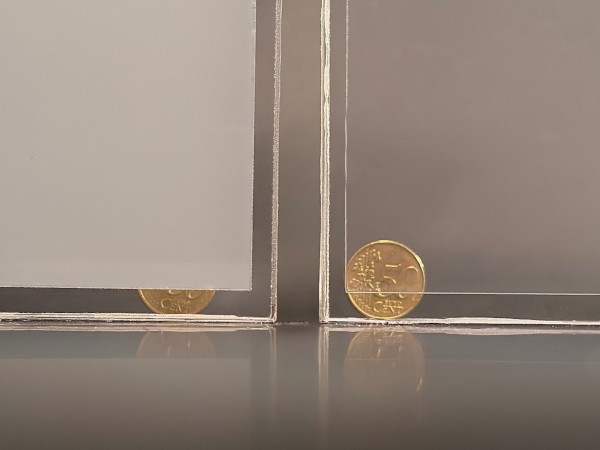
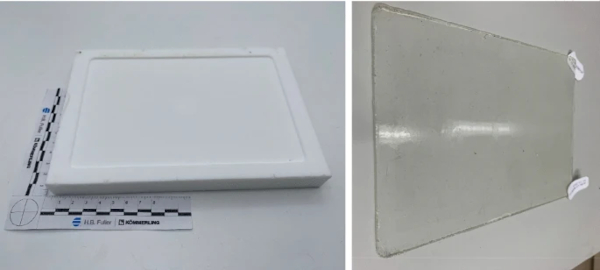
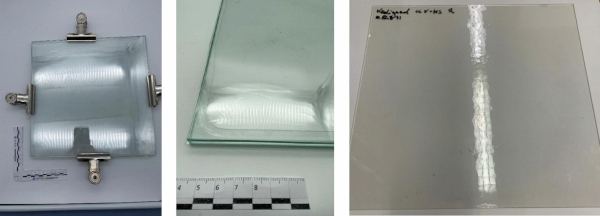
The interlayer foils were provided on rolls by each manufacturer, with moisture levels left undefined. Similarly, the liquid cold-poured adhesives were manufactured and cured by the supplier before being provided in sheet form, facilitating specimen production through stamping for each material. The respective molds as well as the fabricated specimens are shown in Fig. 1 for the Polyurethane and in Fig. 2 for the UV-Acrylic. For the latter, it is also crucial to prevent contact with the air during the curing process. This is ensured with non-sticking plastic films that remain on the material even after the curing process until stamping. During the pouring process of the liquid adhesives, it is important to ensure consistency in the amount of adhesive used and to keep the substrate of the pouring mold as even as possible. However, variations in the measured thicknesses of the test specimens may occur from batch to batch, as seen in Table 1, particularly for the 2part-PU.
Ködiguard UV-HS R is a UV-curing acrylate adhesive with a Young’s Modulus of 34 MPa and an elongation at breakage of 380%, according to the manufacturer [see HB Fuller/Kömmerling (2015a)]. In the cured state, the material behavior resembles a crosslinked thermoset with a glass transition temperature at 29 °C. The adhesive can be applied in laminated glass with float glass with a minimum thickness of 1.0 mm. A maximum layer thickness is not specified, but the number of laminate layers is limited to a maximum of 6 and the total laminate thickness to 50 mm (see HB Fuller/Kömmerling Technical Information). The duration of the curing process depends on the intensity of the UV light source, as well as the thickness and type of the glass panes. However, it is imperative to guarantee a minimum curing time of 20 min. The maximum dimensions of laminated glass sheets using Ködiguard UV-HS R are limited primarily by the required surface for UV radiation and the considerable volume shrinkage of the adhesive of 12.4%, which can be counteracted by targeted overfilling of the laminates. According to the manufacturer, laminated glass panes of 3 m × 6 m have been realized using Ködiguard UV-HS R.
Ködistruct LG is a two-component polyurethane system that also cures to a crosslinked thermoset, but shows a substantially stiffer behavior than the UV-acrylic. Based on the literature study in Sect. 1, Ködistruct LG emerges as the most extensively investigated liquid adhesive in the field of laminated glass interlayers. The Young’s Modulus is 65 MPa, the maximum elongation is 230%, and the glass transition temperature is 48 °C [see HB Fuller/Kömmerling (2015b)]. Moreover, Ködistruct LG was already approved for use in laminated safety glass from 2016 to 2020 according to the approval abZ Z-70.3-240. Thereafter, the manufacturer did not apply for an extension of the approval. Ködistruct LG is applicable in thicknesses of 0.8 to 6 mm in laminated glass with float glass and has a significantly lower shrinkage of 3.4% but needs to cure for seven days before it has built up its final material properties. The maximum dimensions of laminated glass sheets are mainly influenced by the pot life of the resin, which is specified in the technical datasheet to be 11 min. So far, dimensions of 2.5 m × 3 m have been realized, according to the manufacturer.
In both cases, the single glass panes are first jointed at the edge with a transparent adhesive tape for the bonding process, which serves as an edge sealing and spacer. Two openings are left in the tape, one to enable the gap between the glass panes to be filled, and the other one to allow excess adhesive material to flow out. Afterwards, both openings are to be closed. Following the correct procedure, an even and bubble-free distribution of the adhesive is ensured.
In contrast to the liquid cold-poured adhesives, PVB, EVA, and SentryGlas® films have been extensively investigated in comparative studies. In the majority of cases, the materials were examined in the laminated state. Within this paper, only the bulk material is examined. Since the examination in the laminated state is essential for an overall assessment and classification of the behavior of the liquid resins, literature from comparative studies in the laminated state is given in the following.
Sable et al. (2019) conducted four-point bending tests on multiple EVA, PVB, and SentryGlas products and analyzed the fracture pattern of the laminated glass depending on the interlayer. In total, 24 different interlayer film products were tested in laminated glass, which further consisted of two to six sheets of annealed soda lime glass with thicknesses of 5 mm or 6 mm, respectively. An interesting result revealed that only 55% of the tested glass laminates exhibited a “post-breakage state”, i.e. at least one pane is already broken, but the laminate is still able to absorb further load. The same tests were also performed by Castori and Speranzini (2017), which examined glass laminates with PVB, EVA, and SG interlayer. Both studies show that the highest stiffness and the highest loads can be achieved with SentryGlas interlayers. The values for PVB and EVA differ greatly, depending on the specific product, but laminates with stiff PVB were indeed close to the properties of SentryGlas, but failed earlier. Serafinavicius et al. (2013a) used tempered glass, which led to a correspondingly higher load capacity.
Briccoli Bati et al. (2010) performed static four-point bending tests with a creep load of about 40% of the expected strength of the laminates consisting of annealed glass and PVB, EVA, and SentryGlas interlayers. The results showed that PVB exhibited the weakest coupling between the glass panes and a comparatively high creep effect, whereas the authors stated a “good” coupling and creep behavior for EVA and SentryGlas. Furthermore, Serafinavicius et al. (2013b) performed creep tests under different temperatures, where again PVB showed the weakest behavior. It should be noted that the geometry (length and width) of the glass panes differed from study to study, and only in Serafinavicius et al. (2013a) and Serafinavicius et al. (2013b) the geometry of DIN EN 1288-3 (2000) was used, which limits the comparison of the results.
Furthermore, several publications have undertaken comparative studies investigating the conventional interlayer materials in small-scale bulk material experiments. Kuntsche (2015) and Schuster (2022) performed DMTA tests on SentryGlas, EVA, and PVB, the latter two also being analyzed by Kraus (2019) and Schuster et al. (2018). Kuntsche (2015) thereby conducted detailed investigations on the specific loading modes with the finding that no loading mode is suitable for both the energy-elastic and entropy-elastic area (see also Sect. 3.1). In all studies, the materials showed fundamentally similar behavior: PVB and SG have a pronounced glass transition area, which is around room temperature for standard PVB and around 50 °C for SentryGlas. EVA exhibits the smallest change in material properties in absolute terms in the temperature range relevant to façade construction.
Uniaxial tension tests were performed by Kuntsche (2015) and Centelles et al. (2020). In both studies, EVA exhibited the highest elongations as well as a higher initial stiffness than standard PVB until the stiffness of PVB increased strongly from about 100% strain. SentryGlas, on the other hand, exhibited a high stiffness at small strains, followed by a plateau phase and finally a further increase in stiffness at high strains. However, it is striking that this initial stiffness of SentryGlas is significantly lower in the results of Centelles et al. (2020) than in other studies [see also Zhang et al. (2015)] as well as the manufacturer’s datasheet (Kuraray 2023).
It should be noted that the previous literature review is focused on comparative studies between interlayer materials and neglects ageing as well as special loading situations such as fire or blast loading. A comprehensive literature review on the conventional interlayer materials, focusing on humidity effects, solar radiation, aging, and mechanical tests, is provided by Martin et al (2020).
3 Experimental program
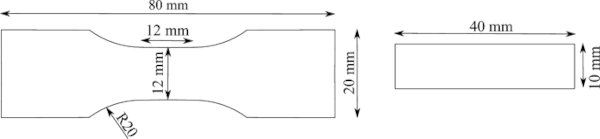
For all room temperature tests (Sects. 3.2, 3.3, 3.4 and 3.5), specimens were shaped following Becker’s specifications (Becker 2009) and tested in a single-column material testing machine from ZwickRoell (Z2.5 zwickiLine). This geometry was formerly used by Schuster (2022), Botz (2020), Kraus (2019), and Kuntsche (2015), ensuring good comparability of the results with the study at hand. It is characterized by a lower length-to-width ratio of the measuring area, compared to specimen geometries of DIN EN ISO 527 (2019), which facilitates optical strain measurement. The test specimens for DMTA experiments were rectangular in shape, measuring 10 mm × 40 mm, and tested in a GABO EPLEXOR 2000 N machine. The detailed dimensions are depicted in Fig. 3.
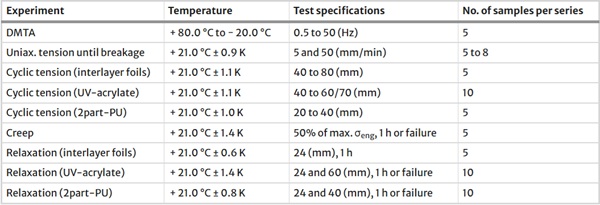
Before testing, all test specimens were conditioned for at least 24 h in a climatic chamber at 20 °C and 50% relative humidity. The tension tests were conducted in a temperature-controlled room at an average temperature of 21.1 °C after the specimens were sprayed for measuring the deformations via Digital Image Correlation (DIC). Due to the high temperature sensitivity of the UV Acrylate and PVB, attributed to their glass transition occurring near room temperature (see Sect. 3.1), precise temperature monitoring during testing is obligatory. Consequently, the temperature of each specimen was measured immediately before the experiment using an infrared scanner, resulting in a maximum temperature deviation of ± 1.4 K within a test series and ± 1.6 K across all conducted experiments. An overview of all conducted experiments is provided in Table 2.
Table 2 Overview of performed material tests - Full size table
Due to the coupling of the DIC measurement system used with the testing machine, it was necessary to execute displacement-controlled testing instead of strain rate-controlled testing, resulting in a non-constant strain rate over time. Subsequently, the cyclic tests were also carried out up to a certain state of displacement, as depicted in Table 2. The uniaxial tension tests until breakage were conducted for all materials at two different displacement rates, with a higher number of specimens tested for the liquid cold-poured adhesives (8) compared to the interlayer films (5), due to a higher variation of the test results (see also Sect. 3.2). The displacement rates were based on the procedures in the literature: Hänig (2023) performed his studies at 1, 5, and 100 mm/min, and Kuntsche (2015) at 5 and 50 mm/min (among others).
The test specifications are presented separately for each material since they differ within the cyclic tests as well as within the relaxation tests. Specifically, in the cyclic tests, the provided numbers in the test specifications denote the deformation achieved during the first and second cycles. For the UV-acrylate, two different levels (60 mm and 70 mm) were tested for the second cycle, see Sect. 3.3. Similarly, in the relaxation tests, two different deformation levels were tested for both adhesives. The interlayer films were only tested at the lower deformation level in the relaxation tests for comparison purposes. At this point, it is important to note that the strains under examination in the tension tests do not occur in the intact state of laminated safety glass. The properties of the interlayers at high strains become relevant if the glass breaks and the residual load-bearing capacity of the laminate needs to be ensured.
3.1 Dynamic mechanical thermal analysis
The dynamic mechanical thermal analysis is specified in DIN EN ISO 6721 for plastics in general and DIN EN 16613 for interlayer materials of laminated glass. Within this test method, the temperature- and time-dependent behavior of a material in the range of small deformations are investigated. Therefore, the specimens are subjected to sinusoidal harmonic oscillation across various temperatures, enabling the detection of the glass transition temperature region (TG) [e.g. see Schwarzl (1990)].
The tests are typically conducted in uniaxial tension, compression, torsion, or shear mode, although more complex setups such as bending tests are also feasible. According to Kuntsche (2015), it is recommended to carry out DMTA tests in torsion mode for the energy-elastic range and in double shear mode for the entropy-elastic range. The tension mode is not recommended primarily because Poisson’s ratio is required as a function of time and temperature to convert the tension modulus into the shear modulus. For the purpose of this paper, which is to detect the glass transition area, the tension mode is preferred since it is simpler to perform. The Poisson’s ratio is obtained from the uniaxial tensile tests at different strain rates and can be examined for temperature dependence through further tests. Furthermore, the tension mode was also used by Hänig (2023), offering good comparability of the results.
The specimens were shaped according to Fig. 3b. A total of 11 frequencies, logarithmically distributed from 0.5 to 50 Hz, and temperatures in steps of 5 K from − 20 to + 80 °C, resulting in 21 temperature steps, were tested. This temperature range is deemed the practically relevant range for façades in construction (see ETAG 002). The results are shown in Fig. 4. It should be noted that the graphs only show the results for a test frequency of 0.5 Hz and 50 Hz separately to enhance clarity.
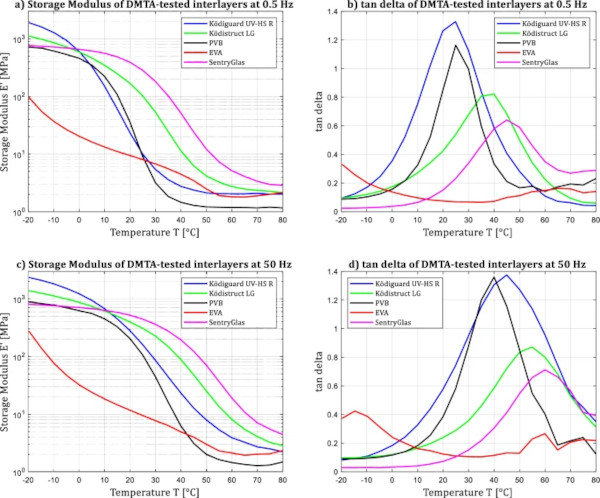
In the following, the values of the glass transition temperature of the investigated materials were determined by the peak of the loss factor, which generally defines the end of the glass transition range. The beginning of this range can be determined using the tangent method according to DIN 65583, in which a tangent is applied to the linear (horizontal) section of the curve and at the inflection point of the steep drop. The intersection of both tangents then marks the initial temperature of the glass transition. As can be seen from Fig. 4, only SentryGlas has a horizontal curve section in the investigated temperature range, so the tangent method cannot be applied.
Nevertheless, the materials show a steep drop in the Storage Modulus as well as a peak of the loss factor, and therefore the glass transition is within the investigated range for all materials with the exception of EVA. Here, a minor peak at − 15 °C is discernible in the curve of the loss factor; however, this does not permit a reliable statement. Nonetheless, this observation is consistent with results in the literature, which suggest that the glass transition temperature for EVA ranges between − 24 and − 12 °C (Schuster et al. 2018; Kuntsche 2015), which results in elastomeric behavior in the investigated temperature range. Notably, Fig. 4b reveals that EVA shows a thermorheologically complex material behavior. In this context, thermorheologically complex behavior is defined by the existence of at least two or more active molecular processes in the temperature range under consideration or if additional vertical displacements and rotations are necessary to shift the individual curves to a mastercurve [see Barbero (2009), Fesko and Tschoegl (1971)]. In Fig. 4b and d, this is evidenced by a dip in the tan delta curve at approximately 30 °C to 40 °C, followed by subsequent increases both below and above this range.
The curves of the other materials align closely with the values from the literature or the manufacturer’s specifications, even though the measurements become increasingly inaccurate at high temperatures above 55 °C, especially under high frequencies. In HB Fuller/Kömmerling 2015a, the glass transition temperature of Ködiguard UV-HSR is specified as 29 °C with a measuring frequency of 1 Hz, which lies in between the measured values of 25 °C for 0.5 Hz and 45 °C for 50 Hz in the study at hand. Ködistruct shows a glass transition between 40 and 55 °C. This is in alignment with Hänig (2023), who states a glass transition of Ködistruct LG at 39.1 °C at 0.5 Hz and 49.4 °C for 10 Hz. According to Kuntsche (2015), the glass transition for standard PVB is between 25.6 and 29.7 °C, depending on the loading mode, which is consistent with the present results for low frequencies. At 50 Hz, the PVB investigated in this study shows a glass transition at 40 °C. Furthermore, the TG of SentryGlas is located between 45 and 60 °C, compared to results from literature of 42 to 49 °C (Schuster 2022) and 53.1 °C to 54.6 °C (Kuntsche 2015).
In the following, the presentation of the master curves and Prony series will be omitted, as material modeling is intended to be the subject of further publication. Regarding the temperature behavior of the adhesives, it is evident that the curve of the UV-acrylate resembles the one of PVB. In both cases, the glass transition region lies slightly above room temperature, whereby the stiffness above 40 °C only reaches very low values. This observation is noteworthy given that PVB is a non-crosslinked thermoplastic, while the UV acrylate, is classified by the manufacturer as a crosslinked thermoset. Similarly, the 2-part PU, which is again categorized as a crosslinked thermoset by the manufacturer, resembles the behavior of SentryGlas (thermoplastic with ion bonds), albeit at a lower magnitude. Here, substantial stiffness values are still present at 40 °C before gradually approaching those of PVB and UV-acrylate from around 60 °C.
3.2 Uniaxial tension tests at different strain rates
The determination of a material’s tensile properties is standardized in DIN EN ISO 527. Accordingly, the uniaxial tensile tests until breakage were conducted at testing velocities of 5 mm/min and 50 mm/min. The results are depicted in Fig. 5, where the stress–strain curves are presented up to an engineering strain of only 200% for clarity, encompassing the maximum strains of the cold-poured adhesives. Stress–strain curves depicting the holistic behavior of the conventional interlayer films can be found in the numerous references (see Sect. 2), the maximum strain and stress values of the material tests at hand are listed in Table 3. Essential to mention is that the curves of all three interlayer films exhibit a significant material stiffening at strains exceeding 200%. For the calculation of the mean engineering stresses of the liquid adhesives, the thickness values determined individually for each test specimen were used.
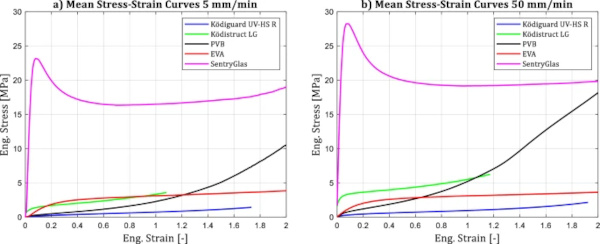
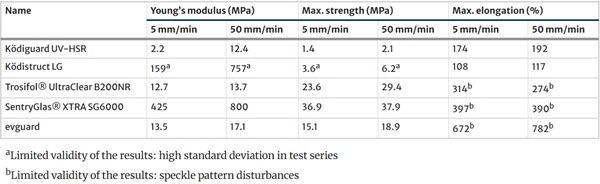
Table 3 Tension test data of investigated interlayer materials - Full size table
In general, all examined materials display highly nonlinear behavior as well as strain rate dependency, with the latter being the least pronounced in EVA. Besides, EVA is the only investigated material that exhibits stress-whitening phenomena at high strains. This effect often occurs in polymeric materials, mostly thermoplastics, where micro-cracks in the polymer matrix (so-called crazes) cause a brightening of the material under strong elongations (Bakshi et al. 1988; Kambour 1973). Nevertheless, this effect can also occur in crosslinked materials, as is known for TSSA (transparent structural silicone adhesive), for example [see Drass (2020)]. The EVA examined in this paper was also crosslinked by the manufacturer before delivery. SentryGlas shows a plasticity region after reaching an initial maximum stress, accompanied by pronounced necking.
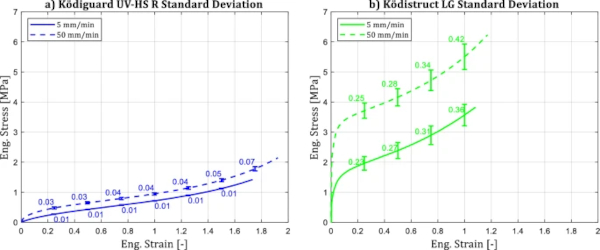
Examining the curves in Fig. 5 and the values in Table 3, it is noticeable, that all values of the UV-acrylate Ködiguard UV-HSR are significantly lower than specified in the manufacturer’s datasheet. There, a Young’s Modulus of 34 MPa and a maximum elongation of 380% are depicted. Similarly, the maximum strength and elongation of Ködistruct LG are considerably below the manufacturer’s specifications. This does not apply to Young’s Modulus, where substantially higher values were determined. However, as indicated by the 1 next to the values, these values should be treated with care: the specimens of each test series showed a striking standard deviation, which is visualized in Fig. 6. Additionally, the stiffness of the specimens seemed to increase disproportionally with their thickness, resulting in a variation of the Young’s Modulus from 25 to 175 MPa for the lower displacement rate. On the other hand, Hänig (2023) obtained even smaller maximum elongations of less than 100% and determined a median Young’s Modulus of 250 MPa with a displacement rate of 5 mm/min and 324 MPa for 100 mm/min, respectively.
The results of the interlayer foils are generally in line with those of the literature, although it should be noted that strain measurement became increasingly difficult with increasing strains above 200%, as the speckle pattern broke up progressively. These values are marked with 2 in Table 3 and deviations between actual and measured deformations are possible. Kuntsche exhibited 250% strain and 23 MPa stress for PVB, 330% strain and 15.8 MPa stress for EVA, and 300% strain as well as 35 MPa maximum stress for SentryGlas. Zhang et al. (2015) investigated SentryGlas under various displacement rates and obtained maximum elongations up to 400% and stresses up to 35 MPa. The deviations to these values can mainly be explained by the different specific products and deviations in the test conditions. In the manufacturer’s datasheets for EVA, an elongation of > 400% and a tensile strength of > 20 MPa is depicted. For SentryGlas, a tensile strength of 42.9 MPa and 600% elongation are denoted.
Comparing the adhesives with the interlayer foils, the PU adhesive shows a higher stiffness behavior at small strains than PVB and EVA. On the other hand, the UV-acrylate exhibits the lowest stiffness values among all the materials investigated. Furthermore, another notable phenomenon emerges: the maximum strains of both adhesives are higher at higher displacement rates than at lower ones, which is illustrated in Fig. 6.
3.3 Cyclic tension tests
Cyclic tests provide insight into hysteresis and inelastic deformations in the material behavior after unloading. This enables initial statements regarding linear or nonlinear viscoelasticity, or viscoplasticity in the respective material behavior. To comprehensively understand the holistic material behavior, cyclic tests should be conducted as close as possible to the material’s maximum strain. However, since the primary focus of this study is on liquid adhesives, and the experiments on interlayer films serve for comparison purposes, the cycles for the films were not extended to the maximum strain, but to a deformation of 80 mm. The maximum applied deformations and the resulting maximum strain levels are depicted in Table 4. The cyclic tension tests were performed with a constant displacement rate of 5 mm/min. The results can be found in Fig. 7. To ensure clarity and ease of interpretation, the experimental results are presented separately for each material.
Table 4 Maximum strain levels of investigated interlayer materials in cyclic tension tests - Full size table
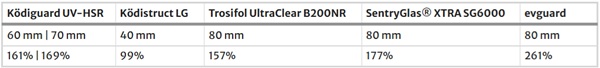
From the graphs, it is initially evident that all materials exhibit significant hysteresis, except for the UV-acrylate Ködiguard UV-HS R. For this adhesive (Fig. 7a), two curves are presented: as an attempt was made to approach the maximum strain as closely as possible, a strain of 169% (i.e. deformation of 70 mm) was chosen for the reloading cycle (indicated by the dotted line). However, during these experiments, it was observed that the test specimens failed on the unloading path shortly after reaching the maximum load. Consequently, the maximum deformation in the second cycle was reduced to 161% strain (60 mm deformation), ensuring that no test specimen failed prematurely, and the 70 mm tests were excluded from further analysis. To further investigate this behavior, it was decided to conduct two relaxation experiments at different strain levels as well (see Sect. 3.5).
The 2-part PU (Fig. 7b) displays significant hysteresis and residual deformation shortly after unloading. However, if the test specimen remains unloaded for an extended period thereafter, complete deformation recovery is observed. Additionally, no specimen failed on the unloading path, unlike the UV-acrylate. It is also noteworthy that the PU adhesive exhibits a softer response on the reloading path compared to the initial loading, and even after reaching the strain level of the first cycle, it shows a significantly lower stress level.
Concerning the three conventional interlayer materials, each exhibits a distinctly different behavior. PVB shows a significant hysteresis and deforms almost completely back to its original length already during the unloading cycle, and completely returns to its original shape after a short time. In contrast, EVA remains with a deformation of more than 100% after unloading, which does not recede and therefore indicates plasticity within the material behavior. Similarly, SentryGlas also shows inelastic deformation after the unloading cycles (see Fig. 7f). After the first cycle, PVB, similar to the 2-part PU, exhibits an inelastic expansion and remains below the maximum stress level for some time, following a curve parallel to the first cycle but horizontally shifted. On the other hand, EVA and SentryGlas immediately return to their original stress path after reaching the previous maximum strain, indicating plastic behavior. It is also noteworthy that EVA exhibits significantly larger strains within the measurement range compared to the other materials, despite all being stretched to the same deformation (80 mm).
3.4 Creep tests
In creep tests, specimens are subjected to a constant stress, and the evolution of strain over time is monitored. In this study, the tests were conducted following DIN EN ISO 899, and a constant force in a uniaxial tension test machine was applied. The applied maximum forces for each material were set at 50% of the respective maximum stress from the tensile tests relative to the initial cross-section, see Table 5. The tests were performed force-controlled with a rate of 0.5 N/s for the UV-acrylate and 1 N/s for the other materials. The holding period was set to one hour, the results are shown in Fig. 8.
Table 5 Engineering stress values of investigated interlayer materials at 50% of maximum tension stress - Full size table
![]()
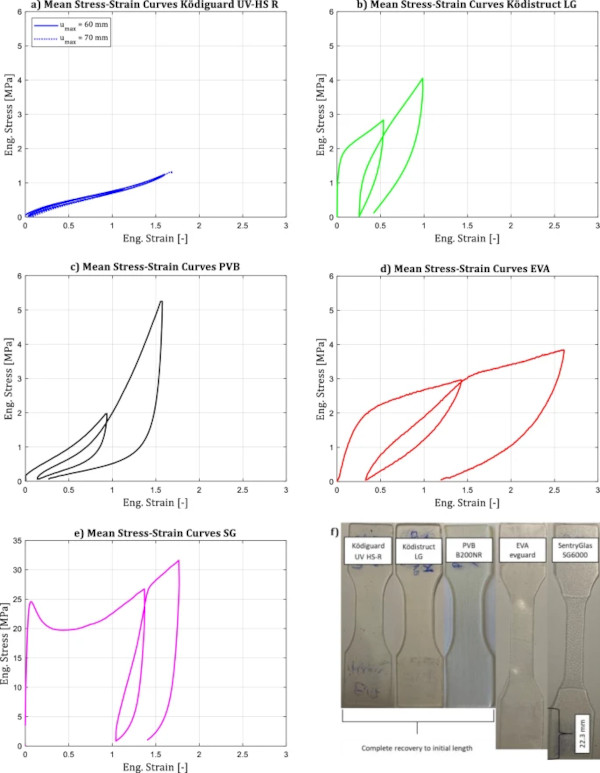
As denoted in the curves, early failure of the liquid adhesives is observed in the creep tests. The maximum discrepancy of the failure time points is again illustrated by the dotted lines in Fig. 8a. The test specimens of the UV-acrylate failed after no more than 8 min, and those of the 2-part PU failed after no more than 13 min, while all test specimens of the interlayer films remained intact. In the graph of SentryGlas, the softening in the material behavior after the initial linear-elastic region at small strains is evident, leading to a considerable increase in strains after exceeding this plasticity stress level. Additionally, the constant creep behavior of EVA is noteworthy.
In Fig. 8b, the evaluation of the Creep Modulus is provided for the tested time period. Note that the time data was set to zero as the maximum load was reached for sake of clarity. According to DIN EN ISO 899-1 the creep modulus is calculated by:
where σ₀ is the applied stress, which is held constant and ε(t) is the measured strain changing with time. It is important to note, that the initial applied stress and the creep modulus strongly depend on the applied deformation rate: the creep modulus is higher using higher deformation rates. Furthermore, the Creep Modulus depends on the initially applied stress. Hence, DIN EN ISO 899-1 states that at least three different stress levels have to be investigated to generate an isochronic stress–strain diagram of the Creep Modulus.
In literature, creep test data on bulk material is limited. In this study, the applied stress was chosen at a comparatively high level and correspondingly high strains. Hänig (2023) calculated the creep modulus for the PU adhesive from the shear modulus with a constant Poisson’s ratio and without stress dependency according to the former approval of the adhesive (see abZ Z-70.3-240). In his calculations, an infinity creep modulus is reached at 3.7 MPa, which is higher than the experimentally obtained creep modulus of 2.4 MPa in the study at hand. Botz (2020) conducted creep tests on PVB specimens under a maximum stress state of 6.84 MPa at different temperatures and relative humidity levels. He provided mastercurves, resulting in a creep modulus, which is at about 1 MPa for 100 s, which is significantly lower than the results at hand. Considering the graph of PVB in Fig. 5, it is apparent that PVB shows a considerable stiffening above the stress level investigated by Botz (2020), which explains the difference in the creep modulus.
3.5 Relaxation tests
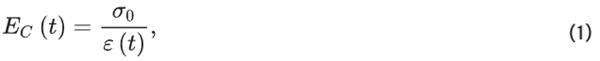
In relaxation tests, a specific strain is applied to the test specimen in a short time and maintained constant for a defined period of time. If the curves in the relaxation tests show a horizontal asymptote, it allows for the calculation of the viscous and elastic components in the material behavior. The depicted experiments, conducted in uniaxial tension mode, followed the proceedings based on DIN EN ISO 899 for creep tests. The holding period was set to one hour. The applied deformation was set to 24 mm for all materials, resulting in strain levels for each material as depicted in Table 6. Due to the necking effect, the elongation in the measuring area is significantly higher for SentryGlas than for the other materials. The resulting curves are shown in Fig. 9a, where the engineering stress is plotted over time.
Table 6 Strain state of investigated interlayer materials at 24 mm displacement in relaxation tests - Full size table
![]()
Based on the results from the cyclic tests, different strain levels were examined in the relaxation tests of the liquid adhesives. The second strain level was chosen according to the maximum strain level of the cyclic tests, which resulted in 60 mm or 161% in mean engineering strain for the UV-acrylate, and 40 mm or 99% mean engineering strain for the 2-part PU.
In Fig. 9a, the curves for both adhesives show that the specimens fail at high strain levels after a certain time, even though a significant percentage of the initial stress has already relaxed. For the 2-part Polyurethane, failure occurs after more than 50% of the applied stress has relaxed. Notably, the failure points varied considerably within the test series, as illustrated by the dotted line in Fig. 9a. It is also discernible that the stress level for both deformation levels is very similar for Ködistruct LG. This aligns with the uniaxial tensile tests, where the curve flattens considerably after an initial high stiffness with further deformation.
In Fig. 9b, the Relaxation Modulus of each material is provided for the investigated time period. Based on DIN EN ISO 899, the Relaxation Modulus is derived using the formula for the calculation of the Creep Modulus by:
where now the strain is constant and the stress is changing with time. In contrast to the creep tests, SentryGlas already passed the plasticity level at the applied deformation state, which leads to a significantly lower relaxation modulus.
Comparing the interlayer films, it can be observed that SentryGlas, PVB, and Ködistruct LG exhibit a significant stress reduction, while EVA and Ködiguard UV-HS R display minor relaxation phenomena. However, more strain states have to be investigated to get resilient values for the Relaxation Modulus. Additionally, it should be noted that a holding period of one hour permits only a partial statement about the material behavior. Examining the curves of PVB, EVA, SentryGlas, and Ködistruct LG, it is apparent that the relaxation behavior is not yet complete, since none of the curves shows a horizontal asymptote. Relaxation tests on bulk material of PVB can be found in Schuster (2023), who conducted tests at different deformation states and temperatures. The results generally confirm the observations for PVB, since no horizontal asymptote was observed even at higher relaxation times.
4 Discussion
The results of the depicted experiments present a dichotomous perspective. On one hand, especially the 2-part PU exhibits promising stiffness behavior, particularly concerning temperature. This adhesive shows a distinctively higher initial stiffness than standard PVB and EVA and provides a three-dimensionally crosslinked molecular structure, which improves the long-term relaxation and creep behavior and therefore is an advantage over the thermoplastic PVB. Furthermore, the glass transition temperature lies at a significantly higher level compared to the one of standard PVB. Consequently, considering that Ködistruct LG was already approved for use as an interlayer for laminated safety glass in Germany (see abZ Z-70.3-240, expired in 2020 and not renewed), it is indeed plausible to outperform laminated safety glass with standard PVB in terms of mechanical performance. However, it is important to note that influences from aging and the environment have not yet been investigated at this stage.
On the other hand, there are several phenomena in the material behavior of the adhesives that necessitate further investigation in future research: Firstly, in the tensile tests, the strains were significantly below those specified by the manufacturer. Since the curing process is assumed to be correct due to production by the manufacturer itself, the reasons for this discrepancy must be attributed to the test conditions, particularly the specimens’ relative humidity and the displacement rate in connection with the specimens’ geometry. According to the manufacturer, the tests forming the basis of the material datasheets were conducted at 23 °C and a displacement rate of 200 mm/min. The test specimens were shaped following S3A geometry according to DIN 53504. The relative humidity during the experiments could not be precisely monitored in both cases.
Since both adhesives exhibited higher elongations in the uniaxial tensile tests at 50 mm/min than at 5 mm/min, it should be checked in further investigations how the adhesives perform at 200 mm/min. However, it must be noted that showing higher maximum elongations at higher strain rates is a generally atypical behavior for polymers. According to the general theory, polymer chains have more time to disentangle at slower displacement rates, resulting in softer material behavior and higher deformations [e.g. Domininghaus (2005)]. In the case of the UV-curing acrylic, it may also be that the elevated temperature in the manufacturer’s tests led to higher ductility. Since the glass transition range of this adhesive is around room temperature, small temperature changes can have a significant impact on the material behavior. The glass transition temperature range of the 2-part PU, however, is around 48 °C, which is why significant deviations in material behavior cannot be explained by slight differences in room temperature alone. These findings suggest that the moisture conditions of the test specimens could have a significant impact on the material behavior. This is also pronounced e.g. in PVB, as observed in previous studies [see Botz (2020)].
In the cyclic tests, the specimens of the UV-acrylate failed at high strains on the unloading path, indicating that the adhesives fail under certain conditions, more or less distinctly below the fracture stress observed in the static tensile tests. This behavior was confirmed in the relaxation tests and also occurred within the tests of the 2-part PU, with the failure times varying strongly from specimen to specimen. Therefore, the observation of an equilibrium stiffness at times towards infinity was not feasible. In general, it must be noted that the standard deviation in the experiments of the polyurethane was high compared to the other materials and seemed to change disproportionately with the thickness of the specimens.
When comparing the behavior of all the investigated materials, it appears that PVB and the liquid cold-poured adhesives exhibit viscoelastic material behavior, while EVA and SentryGlas viscoplastic behavior, the latter also observed by Kuntsche (2015). Furthermore, the glass transition range for PVB and the UV-acrylate is around 20 °C, which results in significantly lower stiffness at temperatures just above room temperature. In this regard, SentryGlas and the 2-part PU offer higher consistency in the temperature range relevant for façade construction.
5 Conclusion and outlook
In this paper, the mechanical behavior of two liquid cold-poured interlayer adhesives was investigated in uniaxial tension mode concerning time and temperature. The experimental program consisted of DMTA tests, tensile tests until failure at different displacement rates, cyclic tensile tests, creep as well as relaxation tests. The three most commonly used interlayer films, PVB, EVA, and SentryGlas, were also subjected to the experimental program to enable well-founded comparability and classification of the results. Since investigations in the literature focused on either small deformations (Wittwer & Schwarz 2013) or applications in thin glass-plastic composites (Hänig 2023), detailed insights into the mechanical behavior at large strains were enabled, which is crucial for the broken state of laminated safety glass.
In general, liquid cold-poured interlayer adhesive systems offer a wide range of potential advantages, primarily in the ability to provide a residual stiffness for load durations towards infinity due to the molecular structure, facile integration of additional components such as displays, and reduced energy consumption during the manufacturing of laminated glass (Hajduk 2024). The results of the conducted experiments demonstrate that the 2-part PU adhesive, in particular, exhibits promising stiffness and temperature behavior. Therefore, this adhesive qualifies for further investigations regarding high-performance interlayer materials for laminated safety glass, for example in cold-bent glass or also integrating technical components. Contrarily, the UV-acrylate showed the lowest values for mechanical properties but has the advantage of easy and rapid manufacturing. Therefore, this adhesive has advantages when the mechanical performance of the interlayer is not crucial but maximum flexibility regarding the applicability or thickness of the interlayer is necessary.
However, in the context of further investigations, it is imperative to first address the uncertainties in material behavior that have emerged, especially with respect to relaxation and creep, which is essential for the residual load-bearing capacity. In addition to these topics, several other challenges that have not been addressed in this paper need to be investigated since there remains a gap in scientific research concerning material behavior under diverse loadings, such as shear, multiaxial loading, and long-term loading, as well as temperature and aging behavior. However, should the positive attributes of the PU resin be corroborated in subsequent tests, particularly in shear tests, a consideration of incorporating the shear modulus into static calculations, analogously to the methodology for SentryGlas, is feasible.