Article Information
- Digital Object Identifier (DOI): 10.47982/cgc.9.587
- Published by Challenging Glass, on behalf of the author(s), at Stichting OpenAccess.
- Published as part of the peer-reviewed Challenging Glass Conference Proceedings, Volume 9, June 2024, 10.47982/cgc.9
- Editors: Christian Louter, Freek Bos & Jan Belis
- This work is licensed under a Creative Commons Attribution 4.0 International (CC BY 4.0) license.
- Copyright © 2024 with the author(s)
Authors:
- Mohammad Momeni - University of Trieste
- Chiara Bedon - University of Trieste
- Sandra Jordao - University of Coimbra
- Nicola Cella - University of Trieste
- Pasquale Lucia - BLDing Studio

Abstract
Glass facades are complex systems in which glass panes are required to interact with many other load-bearing and secondary components. As a matter of fact, they represent a physical barrier expected to offer long-term structural safety, functionality and durability. On the other side, many influencing parameters make them possibly vulnerable (especially glass) and thus eventually reduce their load-baring capacity, or functionality. The effect of different mechanical and thermal boundaries and loading conditions, ambient and long-term effects, affect especially insulated glass components with continuous modifications that can alter the performance of glass components, and also minimize their capacity. It is thus of primary importance, in support of an optimal maintenance strategy for facade systems, to possibly track their response in time, and prevent major faults or performance losses, or even risk for customers. However, key performance indicators (and corresponding sensors) to monitor the response of these composite systems should be first properly detected, and supported by a robust assessment of tracked registrations towards properly established alert values. In this context, this study explores from an analytical and numerical point of view the performance of Double (DGU) and Triple (TGU) insulated glass units, when exposed to ordinary loading conditions. The goal of present analyses (preliminary to experiments) is to capture some important performance indicators, study their modification as a function of boundary/loading conditions, and define possible monitoring strategies to support the implementation of an efficient early warning system for smart facades.
1.Introduction and Methodology
Insulated glass units (IGUs) are widely used in modern building construction especially for curtain walls and windows, as they provide a level of acoustic and thermal insulation that is far superior to that of a single panel. Due to the relatively low tensile strength and inherent brittleness of glass material and considering the increasing prevalence of these systems in architectural designs, understanding the behaviour of such structures under various loads is crucial to prevent potential damage. Numerous research studies in the literature are dedicated to exploring the responses of glass structures, including curtain walls, under different loads that a summary of them can be found in (Momeni and Bedon 2023; Bedon et al. 2018).
IGUs consist of multiple glass panes separated by a hermetically sealed cavity to prevent moisture intrusion and gas permeation. The most common IGUs are Double (DGUs) and Triple (TGUs) units, which are respectively featuring two and three layers of glass, either monolithic or laminated. The cavities between panes are filled with a mixture of air and gas (e.g. krypton, argon, xenon) to obtain greater thermal insulation. Any residual moisture is absorbed by a desiccant in the spacer along the edges. The gas enclosed inside the cavities determines two important aspects. Firstly, the presence of the fixed quantity of gas causing actions which are applied to only one pane is known to develop effects in the other IGU panes (i.e.,load sharing). Secondly, the gas may exert non-negligible pressure on the inner surfaces of glass, as weather and altitude conditions change. IGUs, in fact, are usually sealed in factory and then moved to the place of final installation, where environmental conditions may be strongly different. When they are sealed, IGUs are in a state of equilibrium, as internal and external pressure and temperature are identical. In contrast, once installed, external conditions are no longer the same as internal conditions and overpressure or depressions may consequently arise inside the cavity. This pressure, since not depending on a change in cavity volume, is known as isochoric pressure. The effectiveness of load sharing is dependent on both the flexural stiffness of the panes and the compressibility of the gas, and thus basically is a primary parameter to assess in the long-term maintenance analysis of facades. Another correlated crucial aspect is represented by the effective airtightness of the sealant. In fact, environmental and loading conditions can affect the airtightness of the sealant, and consequently reduce load sharing phenomena, leading to an overall performance loss for the IGU.
Therefore, monitoring the IGUs performance over time to prevent significant faults, loss of efficiency, or potential risks for customers becomes an increasingly crucial concern for these structural systems. In the literature, various codes (such as the EN16612 and UNI11463 documents) provide guidelines forthe analytical analysis of IGU panels, both DGUs and TGUs. With the additional support of Finite Element (FE) models (Abaqus), this paper investigates the behaviour of such systems to capture some important performance parameters in the long-term period. Initially, the IGU behaviour under wind (i.e., as a quasi-static out-of-plane uniform pressure) is verified, using proven analytical methods to validate the FE procedure. After that, the FE model is further extended to account for the performance over time of such structural components, by including some further influencing parameters (first of all, the effect of non-perfectly airtight cavities).
2. Geometry description of the examined IGU configurations
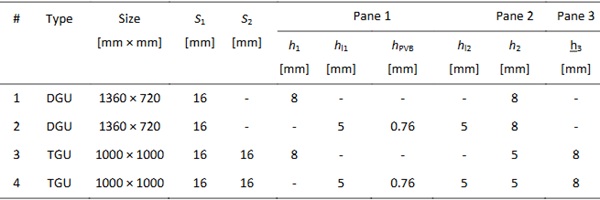
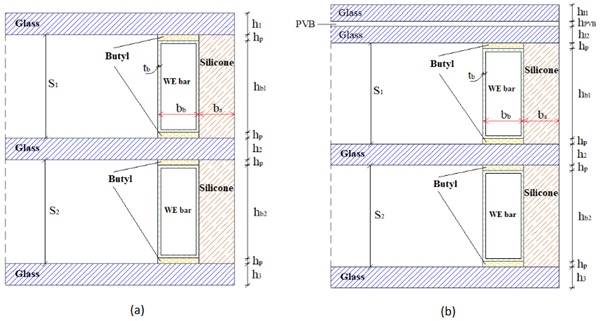
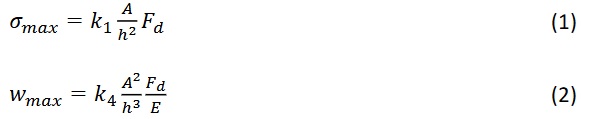
For the analysis herein presented, four different IGU types are considered (two DGUs and two TGUs). Table 1 and Fig. 1 summarize the most important features. S1 and S2 are the thicknesses of argon-filled cavities, while the thickness of monolithic glass in panes 1, 2, and 3 is respectively defined by h1, h2 and h3. For IGU #2 and IGU #4, the first pane is composed of a double PVB-laminated glass section. In these cases, the thickness of glass layers is defined as hl1 and hl2, while hPVB is the thickness of PVB. For all the examined systems, the spacer connections consist of a Warm Edeg (WE) bar, with butyl primary seal and silicone bond serving as secondary seal.
Table 1: Details of the examined IGU configurations.
3. Supporting analytical methods
In practice, the response of DGUs and TGUs under external and internal loads can be analysed by efficient formulations given by codes and regulations. Among others, the UNI 11463 and CNR DT 210 (2013) codes were used for this study, along with the EN 16612. For layered glass, moreover, the Enhanced Effective thickness model was taken into account (Galuppi and Royer-Carfagni 2012). The deflection and maximum principal stress in each glass pane were calculated based on the von Karman theory of thin plates (1907):
The parameters k1 and k4 are defined as a function of IGU aspect ratio (λ= a/b) and normalised load p*. The other relevant formulations for the estimation of these parameters can be found in the EN16612 2019 and UNI11463 2022 documents, and are not reported herein, for sake of brevity.
3.1. Load sharing in DGU systems
In a DGU, when subjected to uniform load, the load sharing effect is known to strictly depend on the relationship between the respective stiffness of glass panes (β1 and β2), and on the insulating unit factor φ:
where a is the shortest IGU side and a* its characteristic length:
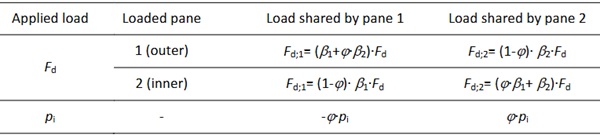
k5 represents the coefficient of volume, which can be also defined as a function of IGU aspect ratio λ, see (EN16612 2019, UNI11463 2022). Based on Eqs. (3)-(6), the load shared in each pane for an applied external action Fd and/or an internal load pi, can be usually calculated based on Table 2.
Table 2: Load sharing of DGU under external and internal load.
3.2. Load sharing in TGU systems
For TGU systems, the analytical procedures proposed by standards are more complicated than for DGU, and are not reported here for sake of conciseness. However, it is worth of mentioning that the basic concept is the same of DGU, in which the force equilibrium for each glass pane should be combined with the gas law for each cavity, to find the TGU response in terms of deflection and stress peaks. More in detail, the formulations in UNI 11463 and EN 16612 were used in the present investigation, to calculate the TGU response under wind and isochoric pressures.
4. Finite Element numerical analysis
4.1. Model assembly and calibration
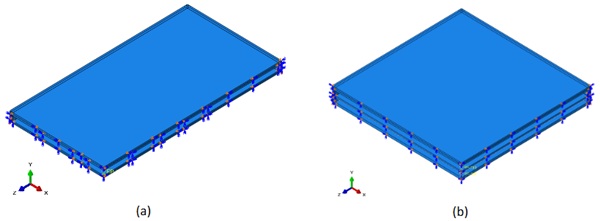
The FE-based Abaqus software was used to simulate the behaviour of IGUs under uniform, quasi-static wind pressure. To this aim, the typical IGU model was built by assembling glass panes and spacer connections (inclusive of WE bar, primary and secondary seals), as it can be seen in the schematic section of Fig. 1. The steel section of the WE bar was replaced by a simplified rectangular shape, measuring bb=6.5 mm × hb=15.5 mm, with uniform thickness (tb=0.1 mm). The butyl thickness was set in hp=0.25 mm. The width of secondary seal parts was assumed as bs=6 mm, with the height equal to the cavity thickness.
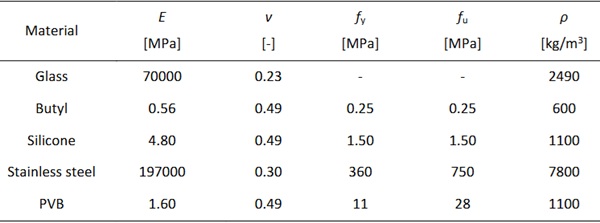
More in detail, butyl and secondary seal parts were modelled by using 8-node brick elements (C3D8R type in Abaqus library), while the WE steel bar was modelled by shell elements, due to its small thickness. To describe the glass panes and PVB layer, various modelling approaches and mesh types, including both solid and shell elements, were employed separately. In the first case, 8-node brick elements (C3D8R type) were taken into account. When using shell elements, the S4R type was employed for monolithic glass layers, while the SC8R type, 8-node quadrilateral in-plane general-purpose continuum shell elements was used for laminated glass. The mechanical interactions between different IGU parts were modelled by means of rigid “Tie” constraints. The material properties for each part are listed in Table 3, based on (Kuraray 2023; Kevin et al. 2013; Bedon and Amadio 2020). It is important to note that the PVB properties can be influenced by factors such as temperature, load duration, strain rate, etc. In the current study, constant values were indeed selected for the mechanical characterisation of PVB, disregarding possible variations. This decision was made – under well-defined time-loading and temperature configurations – to facilitate a preliminary direct comparison between different analysis methods, where consistent parameters were maintained across all cases.
The IGU was constrained at the nodes along the edges of a glass panel, with only the out-of-plane translation being rigidly fixed. This choice aligns with the CNR-DT210 (2013) suggestion for boundary conditions. To minimize the computational cost of models, only a quarter IGU was described with symmetry conditions (Fig. 2).
Table 3: Input material properties for the FE model of IGU parts.
4.2. Cavity configurations
In order to perform the parametric analysis, the implicit solver with quasi-static application was adopted. Geometrical nonlinearities were also taken into account. The cavity space was modelled by using three different strategies:
- The “fluid cavity interaction” of Abaqus library was used to simulate the pneumatic behaviour of gas and its compressibility. In this case, the ideal gas molecular weight was defined as 39.948 g/mole. This first model was adopted to simulate the ideal case in which the cavity is perfectly airtight.
- The “fluid exchange interaction” of Abaqus library was added to the previous model (with the Explicit solver) to implement the possible outflow of gas from the cavity. The latter was defined as a function of cavity pressure due to the applied external load, to simulates a cavity that is not perfectly airtight.
- A third model assembly without “fluid cavity” and “fluid exchange” interactions was also taken into account, in order to consider an ideal lower performance limit for glass panes (load sharing disregarded).
5. Discussion of preliminary analytical and numerical results
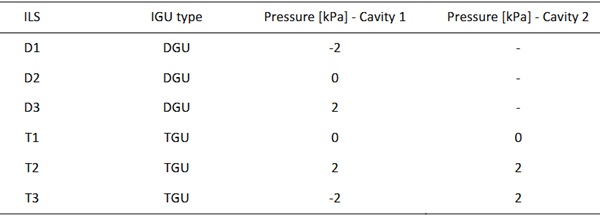
All IGUs configurations presented in Table 1 were analysed by both analytical and numerical methods, to compare deflection and maximum principal tensile stress estimates. For each IGU configuration, various internal load scenarios (ILS) were considered by choosing different values for isochoric pressures for the cavities (Table 4). The values in Table 4, more in detail, were selected to simulate a similar behaviour for winter and summer climate loads.
Table 4: Selected internal load scenarios (ILS).
5.1. IGU #1
Fig. 3 presents the analytical and numerical results for IGU #1. As shown, when all glass panes are monolithic, there is a very good agreement for deflections of panes 1 and 2 (δ1 and δ2) based on analytical and numerical methods (both solid and shell element types), with only a maximum scatter up to ≈3%. Furthermore, the results show that considering a negative isochoric pressure leads to a negative and positive deflection respectively in panes 1 and 2. In case of positive isochoric pressure, the initial deflections caused in panes 1 and 2 are positive and negative, respectively. In terms of maximum principal stresses in panes 1 and 2 (σmax1 and σmax2), a similar trend between numerical models and analytical methods is observed. As the magnitude of wind pressure increases, there is a corresponding increase in stress values.
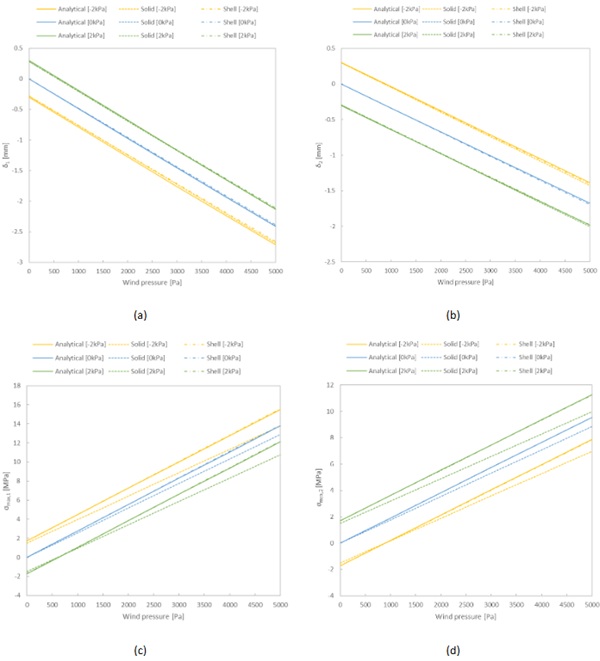
The performed numerical analyses, employing solid elements (C3D8R), involve segmenting the glass into four layers along its thickness. In this case, in IGU #1, the maximum disparity between numerical and analytical methods is approximately ≈20% when four mesh layers are considered. The error diminishes to about ≈11%, ≈6% and ≈5% as the number of layers is adjusted to 8, 16 and 28 respectively. However, by implementing solid elements C3D20R instead of C3D8R, the results are improved when using 4 mesh layers through the thickness, with maximum scatter up to ≈1.1%.
Considering that the numerical response of IGUs (when using solid elements) strongly depends on the number of FE elements in the thickness of glass, as well as on the type of solid element, but a rise in computational cost should be taken into account, additional comparative analyses were performed with shell elements (S4R type with 7 integration points along the thickness). The obtained deflection results for panes 1 and 2 were quantified in -2.38 mm and -1.69 mm respectively, with a ≈1.24% and ≈1.18% deviation from the analytical results (Fig. 3). In terms of stress peaks, the maximum value for panes 1 and 2 was measured in 13.69 MPa and 9.44 MPa respectively, showing a ≈0.7% and ≈1% scatter from the analytical results. It is noteworthy that increasing the number of integration points along the thickness further reduces this error, indicating that results from shell elements not only closely approximate more refined numerical analyses, but also significantly decrease the computational efforts.
5.2. IGU #2
The results for IGU #2 subjected to uniform wind pressure and varying isochoric pressures, are systematically presented in a Table 5 (maximum deflection and principal stress under an imposed wind pressure of 5 kPa). As shown, the deflection estimates from FE model based on shell elements are close to the analytical ones, and the scatter between them is up to ≈2.2%. In case of FE model based on solid elements, the difference reaches up to ≈11% with C3D20R element type, and up to ≈25% with C3D8R type. In terms of maximum principal stresses in pane 1, the peaks in each glass layer (σmax1_Layer1and σmax1_Layer2) from the analytical method differ with FE estimates with both solid and shell elements, but there is a good agreement between numerical methods together. For pane 2, the analytical stress (σmax2) is in good agreement with FE estimates, with up to≈1.3% scatter for the shell model, but up to ≈10% for the solid model.
Overall, the results from both analytical and numerical approaches demonstrate a very good consistency in terms of maximum displacement. Despite the analytical method does not provide accurate results in terms of stress peaks for laminated IGUs, it can be used to effectively assess the deflection and (in most cases) stress peak trends with reasonable accuracy, and thus offers high benefits during the preliminary design stage.
Table 5: Results for IGU #2, as obtained from analytical and numerical methods.
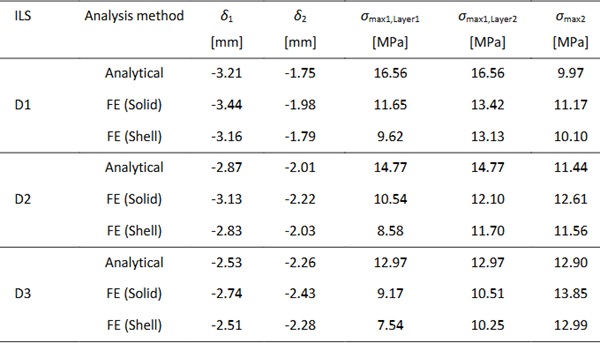
5.3. IGU #3 and IGU #4
The comparative results for IGU #3 and IGU #4 are briefly presented in Table 6. There is a notable agreement between the analytical and numerical methods, especially concerning deflection peaks. In terms of stress analysis, a major improvement in the accuracy of results is achievable by incorporating additional mesh discretization for glass in thickness, or replacing the C3D8R element type with the C3D20R one.
Table 6: Results for IGU #3 and IGU #4, as obtained from analytical and numerical methods.
6. Sensitivity of performance indicators
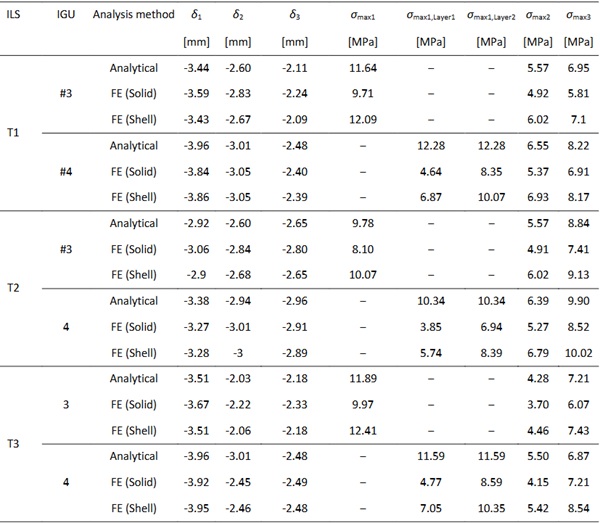
6.1. Cavity effects
Over time, due to gradual failures occurring in connections (particularly in primary and secondary seals) the cavity may be affected by progressively reduced functionality, which is not optimal as for a perfect airtight cavity. In such cases, a partial load sharing can still occur, but not as effectively as in a perfect airtight cavity. To capture this intermediate behaviour and mechanical response, the “fluid exchange interaction” was thus employed in Abaqus to account for the possible outflow of gas from the cavity. This was defined as a function of cavity pressure due to the applied external load.
Figs. 4 (a)-(c) present the comparison of deflection values as a function of time for panes 1 (loaded), 2 and 3 (unloaded). The selected results are obtained for cases with perfect fluid cavity (“Yes Cavity”), without fluid cavity (“No Cavity”) and with the fluid exchange interaction (“Exchange Cavity”) for IGU #3 under the effect of 5 kPa wind pressure. According to Fig. 4, in the “No Cavity” case, the values of δ1, δ2 and δ3 at the end of analysis are estimated in -5.64 mm, -0.50 mm and -0.31 mm respectively. In this case, a substantial portion of the applied load is transmitted through pane 1, while panes 2 and 3 bear a very small amount of the applied load. It's noteworthy that the load transfer occurs through spacer connections, rather than relying on cavity performance. For the “Yes Cavity” case, the obtained values δ1, δ2 and δ3 are -3.64 mm, -2.89 mm and -2.30 mm respectively. Considering the performance of the fluid cavity, the applied load is distributed among the three panes, and each of them bears an acceptable part. For the “Exchange Cavity” case, finally, δ1, δ2 andδ3 are quantified in -5.38 mm, -1.98 mm and -0.36 mm. The obtained results indicate that the actual deflections lie between the “No Cavity” and “Yes Cavity” scenarios. As such, through the “fluid exchange interaction”, it is possible to replicate the long-term behaviour of an IGU, which is characterised by a non-perfectly airtight cavity and a reduced load sharing mechanism. To note that similar results were obtained also for IGU #1, as shown in Fig. 4 (d).
6.2. Deflection and stress analysis
Based on earlier investigations, it is evident that long performance of a panel, over time, may be affected by transition from an ideal airtight cavity to a not perfectly airtight one, which consequently affects its overall performance. In real-world structures, assessing the response of each panel necessitates practical diagnostic tools capable of monitoring their structural behaviour. Through the integration of low-cost sensors, supported by preliminary existing findings, it becomes feasible to achieve this goal to investigate the condition and performance of the structure.
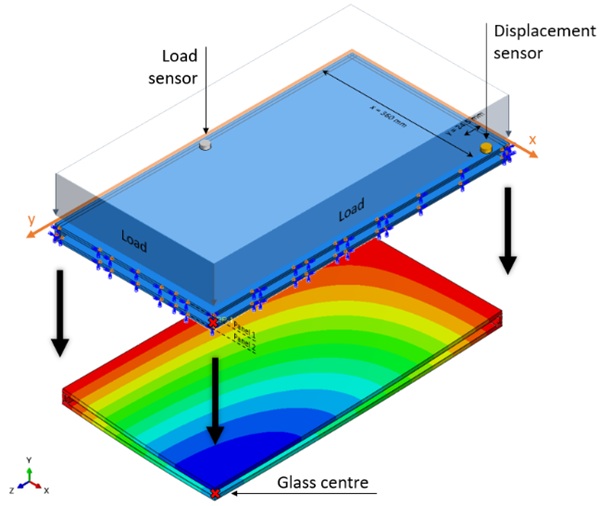
Fig. 5 presents a schematic drawing of possible monitoring system, which can be further supported by simple analytical considerations. Drawing upon the principles of shell and plate theory, the deflection of a member with defined boundary conditions under an applied load can be generally expressed based on the shape function, which relies on geometry, boundary conditions, and material properties.
For example, in the case of a rectangular panel with pinned boundary conditions on all four sides, the displacement function at any point (x, y) on the panel and the maximum mid-span displacement at the panel centre (x=a/2, y=b/2) can be mathematically described by Eqs. (7) and (8), see (Timoshenko and Woinowsky-Krieger 1959):
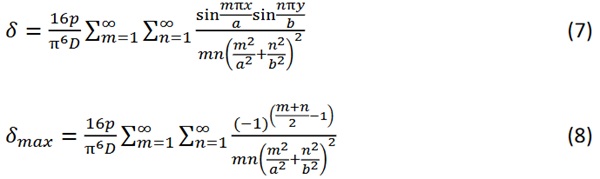
with m=1,3,5,... and n=1,3,5,..., while p is the uniform load intensity; a and b are the panel dimensions (a < b), and D is the flexural stiffness of the plate.
Assuming that the IGU panel is monitored as schematized in Fig. 5, the possible strategy is described in Section 6.3.
6.3. Practical example
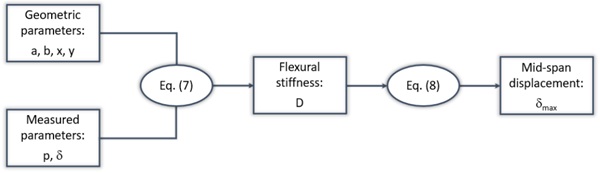
Let’s consider IGU #1 and the scenario with a perfectly airtight cavity (ILS D2). The numerical analysis results in a maximum displacement of pane 2 (unloaded) of -1.70 mm. A selection of numerical results can be used – in combination with Eqs. (7) and (8) – to determine the maximum out-of-plane displacement.
We can assume that there is a sensor positioned as in Fig. 5 on pane 2 (x=360 mm, y=24.5 mm), to capture the displacement over time. From the numerical analysis, the deflection at this point is expected in -0.159 mm (5 kPa wind pressure).
Based on the known parameters, Eq. (7) can be used to express the flexural stiffness of the examined IGU, that in the present calculation example is D=7.42∙10¹² Pa∙mm³. Once this parameter is known, Eq. (8) can estimate the mid-span displacement. In this example, the proposed approach results in a displacement of 1.76 mm, which has a ≈3.4% scatter from the numerical one. The mentioned steps are also summarized in the flowchart of Fig. 6.
Whilst still preliminary, this practical example demonstrates the high accuracy of the proposed approach when applied to an IGU with a perfectly airtight cavity. However, future studies may further increase its accuracy for general applications. Furthermore, the applicability of the method to real cases (i.e., IGUs with non-airtight cavities) will be also addressed through experimental tests on full-scale samples.
7. Conclusions
In this paper, the behaviour of various Insulating Glass Units (IGUs) was comprehensively examined under the influence of quasi-static uniform wind pressure and weather actions. To this aim, a combination of analytical methods and numerical Finite Element simulations using Abaqus software was employed. The discussed findings indicate that the analytical approach is efficient for determining the response of IGUs with a high degree of precision, with results exhibiting a favourable alignment with those obtained from numerical simulations.
Particularly, numerical results obtained through solid and shell elements closely approximate the analytical method in scenarios where there are no layered glass sections. A major improvement in solid element results was observed when adopting C3D20R elements in place of C3D8R, albeit with an associated increase in computational cost. Conversely, continuum shell elements emerged as an efficient approach, offering not only time saving but also reliable mechanical estimations. Most importantly, numerical simulations were extended to analyse IGUs with non-ideal cavity configurations, exhibiting a mechanical behaviour between the two idealized cases of IGUs with and without cavity and load sharing effects. While the analytical method is not able to capture the response of IGUs in such scenarios, the numerical simulations were found capable of investigating these complex cases, that are of primary interest for real IGUs in buildings.
Furthermore, leveraging reverse engineering techniques and supported by the classical theory of shells and plates, a simple methodology was proposed to predict and monitor the response of real IGUs, based on recorded data by sensors. The preliminary assessment of this methodology demonstrates promising accuracy, and thus a possible applicability as early warning system for real smart facade components and ystems. However, further investigation are required to explore its efficiency in different realistic scenarios.
Acknowledgements
The present investigation is part of an ongoing Italian Recovery and Resilience Plan (PNRR) research project about the “Optimized design of modular panels for smart facades”, carried out at University of Trieste in collaboration with the University of Coimbra and BLDing Studio facade consultants. The publication has been produced with co-funding from the European Union - Next Generation EU.
References
Bedon, C. and Amadio, C.: Mechanical analysis and characterization of IGUs with different silicone sealed spacer connections-Part 2: Modelling. Glass Structures & Engineering, 5, pp.327-346 (2020). https://doi.org/10.1007/s40940-020-00123-9
Bedon, C., Zhang, X., Santos, F., Honfi, D., Kozłowski, M., Arrigoni, M., Figuli, L. and Lange, D.: Performance of structural glass facades under extreme loads–Design methods, existing research, current issues and trends. Construction and Building Materials, 163, pp.921-937 (2018). https://doi.org/10.1016/j.conbuildmat.2017.12.153
Bennison, S. J., and I. Stelzer.: Structural properties of laminated glass. Short course, glass performance days, Tampere (Finland)(2009).
CNR-DT 210.: Guide for the design, construction and control of buildings with structural glass elements (2013).
EN 16612: Glass in building—determination of the lateral load resistance of glass panes by calculation (2019).
Galuppi, L., & Royer-Carfagni, G. F.: Effective thickness of laminated glass beams: New expression via a variational approach. Engineering Structures 38: 53-67 (2012). https://doi.org/10.1016/j.engstruct.2011.12.039
Kármán, Th V.: Festigkeitsprobleme im maschinenbau, Mechanik 311-385 (1907). https://doi.org/10.1007/978-3-663-16028-1_5
Kevin, C., van Doormaal, A., Haberacker, C., Hüsken, G., Larcher, M., Saarenheimo, A., Solomos, G., Stolz, A., Thamie, L. and Valsamos, G.: Resistance of structures to explosion effects. Review report of testing methods. Ispra: European Commission-Joint Research Centre (2013).
Kuraray co.: Technical data: Elastic properties (2023). https://www.trosifol.com/fileadmin/user_upload/tools/downloads/technical_information/kuraray-Elastic-Properties.pdf
Momeni, M., Bedon, C.: Review on Glass Curtain Walls under Different Dynamic Mechanical Loads: Regulations, Experimental Methods and Numerical Tools. Façade Design – Challenges and Future Perspective (2023). https://www.doi.org/10.5772/intechopen.113266
Timoshenko, S., & Woinowsky-Krieger, S.: Theory of plates and shells (Vol. 2, pp. 240-246). New York: McGraw-hill (1959).
UNI 11463: Vetro per edilizia - Determinazione della capacità portante di lastre di vetro piano applicate come elementi aventi funzione di tamponamento - Procedura di calcolo (2022).
Wölfel, E.: Nachgiebiger verbund. eine näherungslösung und deren anwendungsmöglichkeiten. STAHLBAU, DER 56, no. 6 (1987).


")