Article Information
- Digital Object Identifier (DOI): 10.47982/cgc.9. 559
- Published by Challenging Glass, on behalf of the author(s), at Stichting OpenAccess.
- Published as part of the peer-reviewed Challenging Glass Conference Proceedings, Volume 9, June 2024, 10.47982/cgc.9
- Editors: Christian Louter, Freek Bos & Jan Belis
- This work is licensed under a Creative Commons Attribution 4.0 International (CC BY 4.0) license.
- Copyright © 2024 with the author(s)
Authors:
- Daniël Wium - MULTI.engineering & Ghent University
- Bert Van Lancker - Vitroplena & Ghent University
- Evert Lataire - Maritime Technology Division, Ghent University
- Jan Belis - Ghent University

Abstract
Integrating glass as a load bearing part of the structure of a ship requires methods of connecting glass to the ship’s structure which are novel within shipbuilding practices. Adhesive bonding is a suitable method of connecting glass to metal in ships and is typically used to bond window panes to metallic frames, although usually with a flexible adhesive. This paper presents the findings of the evaluation of an epoxy adhesive for structural glass to steel continuous bonds. The epoxy adhesive is chosen for its high strength and load transferring capabilities. To accommodate geometric tolerances on the linear bonding surfaces of the glass and steel substrates, and to reduce strains within the adhesive, the application of a relatively thick layer of adhesive is evaluated. However, as this thickness is significantly larger than the recommendation of the adhesive manufacturer for optimal strength, its consequences on the mechanical performance of the bond need to be investigated. Therefore, tensile tests are performed with standardised dumbbell specimens at various strain rates. Shear tests are also performed with glass-steel double-lap bonded joints, to evaluate the shear strength of the epoxy with a thick layer and various bonding surface preparation methods.
1. Introduction
Glass has long been used as a reliable structural material in the building industry. Now, there is thepotential for the application of structural glass in the marine industry as luxury yacht builders look for ways of drastically expanding glazed areas in their ship designs (Gizzi & Bennison, 2009; Moupagitsoglou, 2020; Verbaas, 2012). Integrating structural glass into the structure of the vessel may allow for the reduction of conventional opaque structural materials (Wium et al., 2023). Presently, yacht builders follow standards which prescribe bonding glass panes directly to the window frame with a flexible adhesive, such as a polyurethane (ISO 11336, 2019, 2020, 2023). However, if glass is to participate as a structural member of the ship, more rigid connections may be required(Wium et al., 2023). To address this, an experimental study is conducted on an epoxy adhesive. This epoxy is chosen as a candidate for glass-to-steel continuous bonds in a ship’s structure based on its high strength and stiffness properties.
Tensile tests on dumbbell specimens of the adhesive are conducted to determine the bulk propertiesin tension. The tensile stresses and the elastic moduli of the dumbbells are recorded. Digital image correlation (DIC) is used to measure the deformation of the specimens. DIC is able to capture the strain distribution across the face of the dumbbells. Thereafter, shear tests were performed on double-lap shear specimens consisting of two glass panes bonded either side of a steel plate. The epoxy adhesive is applied in a relatively thick layer (6 mm and 12 mm), which is chosen to accommodate geometric tolerances on the linear bonding surfaces of the glass and steel. The thicker adhesive also potentially reduces strains within the adhesive, which may be advantageous due to the prevalence of high deformations in a ship’s structure. These bond thicknesses are significantly thicker than therecommendation of the adhesive manufacturer (< 1 mm) for optimal strength. Therefore, the impact of the thicker bond on the mechanical performance of the adhesive needs to be investigated. From these tests, the shear strength of the adhesive is measured.
2. Materials and methods - test setup
2.1. Dumbbell specimen preparation
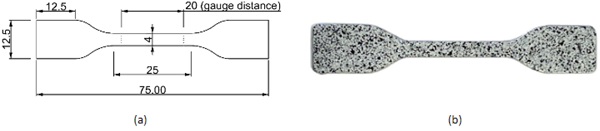
Dumbbell specimens are fabricated according to the standard ISO 37 (2021) with Type 2 dimensions, as shown in Fig. 1. The two parts of the adhesive are extruded from their cartridge container using a caulking gun which dispenses the adhesive through a mixing nozzle. The adhesive is dispensed intoopen moulds made from polytetrafluoroethylene (PTFE) to create the dumbbell shape. PTFE is used to prevent the adhesive from bonding to the mould and to easily remove the dumbbells once they are cured. The moulds are first cleaned with acetone before dispensing the adhesive and afterwards dried with a lint-free cloth to remove acetone residue. Once the adhesive is dispensed into the moulds, the moulds are placed in a climate controlled room with a temperature of 21 ± 1 °C and 60 ± 5 % relative humidity to cure for at least 7 days before testing, as recommended by the manufacturer.
For the measurement of displacements using DIC, a speckle pattern of black paint is applied to one side of each dumbbell, as shown in Fig. 1. The DIC system makes use of two cameras which capture images of the specimen simultaneously during the test at a set frequency. Afterwards the images are processed by the software VIC-3D, from Correlated Solutions, which computes the deformation of the speckle pattern on the specimen surface. The software calculates a displacement vector field between consecutive photos. It was found that black speckles on a white background produce the best contrast for the DIC cameras, which improves the accuracy of the measurements. Therefore, the dumbbells arefirst coated with a layer of white paint before spraying on the black speckles.
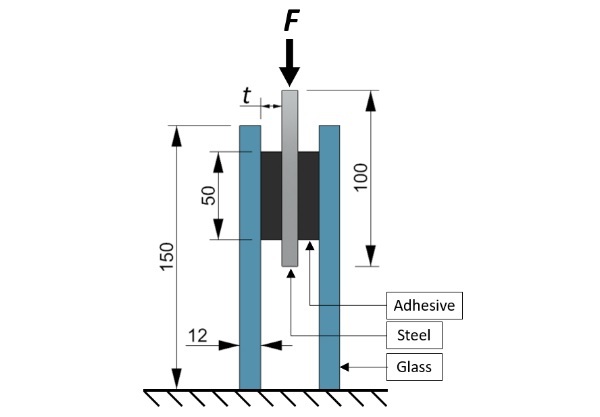
The double-lap shear (DLS) specimens are fabricated by bonding two glass panes either side of a steel plate, as shown in Fig. 2. The dimensions of the glass panes are 150 x 150 x 12 mm and the steel plate 100 x 90 x 8 mm. The glass panes are at the same height either side of the steel plate. For each specimen, the adhesive is applied in a thickness, t, ranging from either 6.3 - 6.4 mm or 12.7 - 13.1 mm, hereafter referred to as 6 mm and 12 mm, respectively. For the 6 mm thicknesses, bond areas of either50 mm x 25 mm or 50 mm x 50 mm are applied per specimen. The length of the bond in the load direction, F, is maintained at 50 mm for all specimens. The smaller bond area was initially chosen for Group 1 and 2 due to the concern that the strength of a specimen with the larger bond area and a 6 mm bond thickness might exceed the capacity of the load cell. For Group 3, the bond area waschanged to 50 mm x 50 mm after it was deemed unlikely that the force would exceed the load cell rating of 100 kN. For the 12 mm thicknesses, a bond area of 50 mm x 50 mm is applied. The rectangular shape of the adhesive is created by dispensing the adhesive into a mould made of PTFE blocks, which are placed between the glass and steel surfaces with a thickness equal to the desired bond thickness.
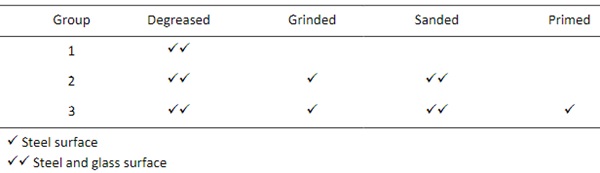
Various methods of preparing the glass and steel surfaces, before applying the adhesive, areinvestigated. In Table 1, the specimens are grouped according to the surface preparation methods. ForGroup 1, the glass and steel surfaces are thoroughly cleaned and degreased with acetone. The steel plates in this group were exposed to air for at least a year and showed signs of oxidation with a brownish discoloration starting to appear. The fabrication of Group 1 specimens was primarily to assess the method of assembling the specimens as well as to verify whether the test setup was appropriate. Thereafter, methods of improving the bond strength were pursued. For Group 2, the surfaces of the steel plates are grinded to remove a layer of approximately 0.1 mm to eliminate the presence of oxidation.
Thereafter, the glass and steel surfaces are again cleaned and degreased, and also sanded with a grid of P320 and P180, respectively. Group 3 receives similar treatments to Group 2, but in this case is followed by the application of a metal primer to the steel surface. The metal primer is recommended by the adhesive manufacturer for improving the bonding strength of the adhesive, especially in humid environments. The primer is applied to the surface using a fine brush and left to dry for one hour before applying the adhesive, as per manufacturer instructions. Once the adhesive isdispensed into the PTFE mould, the DLS specimens are left to cure for at least 7 days in the climate controlled room with a temperature of 20 ± 1 °C and 60 ± 5 % relative humidity before testing.
Table 1: DLS specimen glass and steel surface preparation methods
2.2. Test setup and equipment
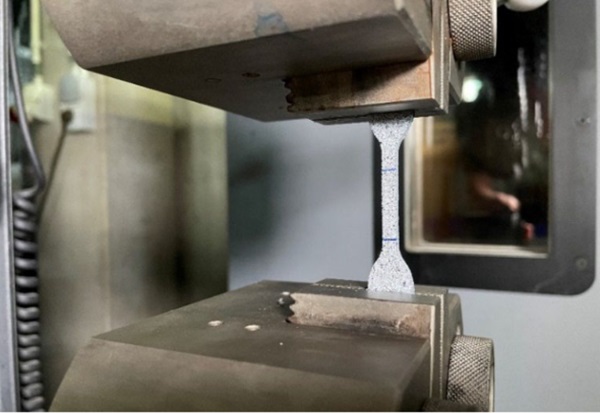
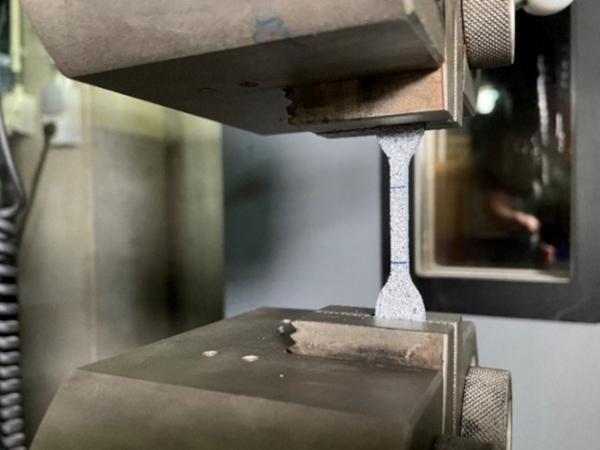
Uniaxial tensile and shear tests are performed using a universal testing machine (UTM). The dumbbells are gripped across a distance of 50 mm, as shown in Fig. 3. Dumbbells are tested at crosshead speeds of 0.1, 1, 10 and 50 mm/min at room temperature and ambient relative humidity. The UTM is fitted with a 100 kN load cell which measures the tensile force for the duration of each test. DIC is used to measure the deformation of the narrow region of the dumbbells across a distance of 20 mm (gauge distance). Two 9 MP (2704 x 3384) DIC cameras are placed vertically above one another in front of the specimen, with their lines of sight creating an angle of approximately 25° with the specimen.
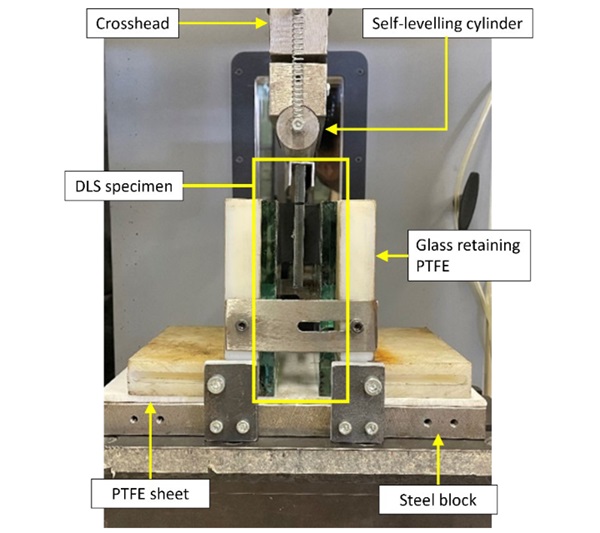
The shear tests are performed by placing the DLS specimen such that the bottom of the glass panes rest on a 5 mm thick PTFE sheet (see Fig. 4), which in turn rests on top of a steel base. For the testing of the third group of DLS specimens, the PTFE sheet is replaced with a 2 mm aluminium plate to provide more rigid support. The crosshead of the UTM is fitted with a self-levelling steel cylinder which applies the vertical force, as indicated in Fig. 2, onto the top edge of the steel plate. The cylinder can pivot around a central resting block and is restrained by two springs at either end. This allows the cylinder to adjust its position such that it makes full contact with the steel edge which may be non-horizontal.Two PTFE blocks are placed either side of the DLS specimen to contain shards of glass once the specimens break during the test. Sufficient clearance is left between the PTFE blocks and the glass panels to avoid restricting lateral movement and the induction of out-of-plane stresses in the adhesive. The shear tests are performed at crosshead speeds of 1 mm/min and 10 mm/min.
3. Results and discussion
3.1. Tensile tests
Engineering stress is calculated for each tensile test by dividing the measured force by the original cross-sectional area of the narrow region of the dumbbell (nominal 4 mm x 2 mm). Engineering tensile strain is calculated by measuring the elongation of the gauge distance (see Fig. 1) and dividing the elongation by the original gauge distance. For each crosshead displacement rate, five dumbbells aretested. The tensile modulus (E) is also calculated according to ISO 527-1 (2019) with the following equation:
![]()
where σ1 is the stress at a strain value of ε1= 0.05 %, and σ2 is the stress at a strain value of ε2= 0.25 %.
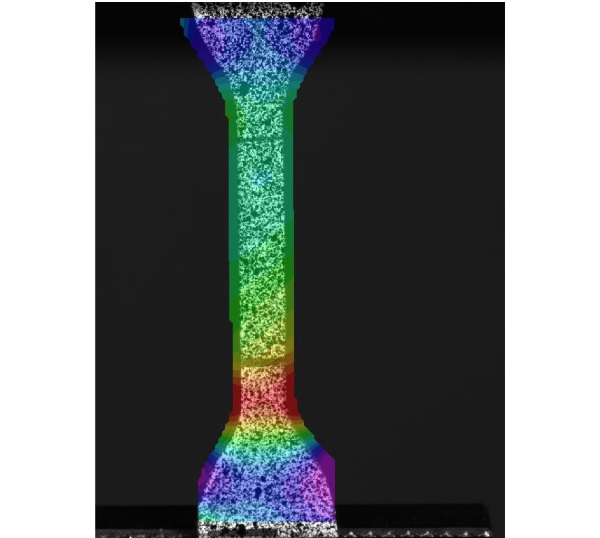
Out of the 20 dumbbell specimens tested, 18 failed near the start of the transition from the narrow region to the wide region. The failure of the specimens at this part of the dumbbell corresponds with the location of the highest longitudinal strains, as computed by the DIC software and depicted in Fig. 5. Eleven specimens also failed with a defect at the breaking point, which includes either a small void within the adhesive or a small lengthwise cavity on an edge. These defects are induced during the production of the dumbbells and are mainly due to the entrapment of air bubbles.
Table 2 gives the average maximum tensile stress, average maximum tensile strain, and the average tensile modulus measured of the 5 tests for each displacement rate.
Table 2: Tensile test results. Standard deviations given in brackets.
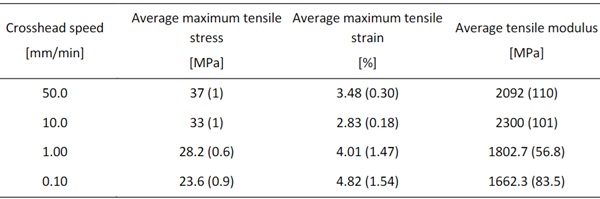
The average maximum tensile stresses recorded in Table 2 show a clear dependence on strain rate, where maximum tensile stress increases with increasing crosshead speed. Similarly, higher crosshead speed result in higher elastic moduli, with the exception of the tests at 10 mm/min which resulted in a higher elastic modulus than the 50 mm/min. These results indicate the viscoelastic behaviour of the adhesive (Ferry, 1980).While higher stresses are recorded for faster crosshead speeds, the maximum elongation of the dumbbells reduces as the speed is increased. In the strain range of 0.05 – 0.25 %, a strong linear behaviour is also observed.
With regards to the epoxy’s use in ship structures, the high stiffness of the adhesive may pose a problem in cases where high deformations are expected from the metallic structure. The more rigid connection may lead to excessive stresses in the glass. However, more information is required which includes the stress-strain behaviour of the adhesive under shear loading. Furthermore, the difference in the coefficients of thermal expansion of glass and steel must be considered when using such a stiff adhesive. Therefore, it is also recommended to determine the temperature dependent behaviour of the adhesive.
3.2. Shear tests
Three DLS specimens are tested for each of the three groups per bond thickness. In Group 1, all three specimens are tested at a crosshead speed of 1 mm/min. With Group 2 and Group 3, the dependency of failure stress on strain rate is investigated. In both Group 2 and 3, two specimens are tested at 1 mm/min and one at 10 mm/min.
During each test, the force at which either one of the two bonds failed in a DLS specimen is recorded.It is assumed that the force applied by the UTM is equally transferred through each of the bonds either side of the steel plate. For each bond, a failure shear stress is then calculated by dividing the respective force by the original bond area. Table 3 and Table 4 give the failure stresses for the specimens with 6 mm and 12 mm bond thicknesses, respectively. Where multiple specimens are tested at 1 mm/min crosshead speed, average shear failure stress is given.
Table 3: Failure shear stress of DLS specimens with 6 mm thickness. Standard deviations given in brackets.
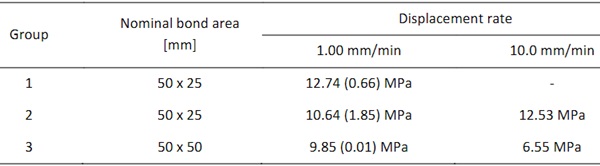
Table 4: Failure shear stress of DLS specimens with 12 mm thickness. Standard deviations given in brackets.
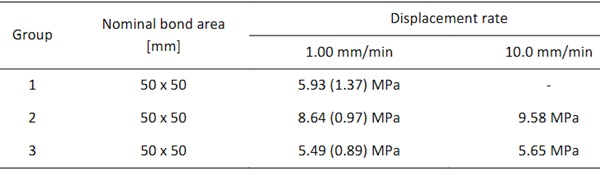
DLS specimens failed by a combination of adhesive and cohesive failure. In all cases, failure occurred at the steel interface. On inspection of the debonded steel surfaces, a thin layer of adhesive remained visible on large areas of the surfaces with smaller areas without any adhesive. The remaining thin layer of adhesive indicates cohesive failure very close to the steel surface. Notably, the adhesive-to-glass bond remained intact after failure. The failure stresses for the 6 mm bonds, are found to be 25 % to 117 % higher than the 12 mm bonds for tests at 1 mm/min, and 19 % to 31 % higher at 10 mm/min. It can also be seen that the application of the metal primer to the steel surface did not improve the shear strength of the bonds. Note that due to the low number of specimens tested in each group, the findings should be taken as preliminary and it is recommended to test additional specimens to improve the statistical significance of the results.
4. Conclusions
Uniaxial and shear tests are performed on an epoxy adhesive chosen as a candidate for glass-to-steel connections in a ship’s structure. Tensile tests are performed on dumbbell specimens. The epoxy is found to be strain dependent: both the maximum engineering tensile stress and the elasticity modulusincreased with an increase in the crosshead speed of the UTM. DIC proved to be an effective method of measuring the deformation of the dumbbells and is able to identify areas of high strain, which corresponded with the location of failure.
Shear tests are performed on DLS specimens with a bond thickness significantly larger than the thickness recommended by the adhesive manufacturer. However, the failure strengths of the DLS specimens are also significantly lower than the 26 MPa shear strength given by the manufacturer (foraluminium substrates) with the recommended thickness. DLS specimens with 6 mm bond thicknessfailed at higher shear stresses than those of the 12 mm specimens, further supporting the finding that bond thickness influences the shear strength of the connection.
Acknowledgements
Financial support was provided by Flanders Innovation and Entrepreneurship (Agentschap Innoveren en Ondernemen) under Baekeland Mandate HBC.2021.0194. The staff of the Magnel-Vandepitte Laboratory at Ghent University are also thanked for their contribution to the production of specimensand advice on test-setups.
References
Ferry, J. D. (1980). Viscoelastic properties of polymers. 3rd edition. In John Wiley & Sons (p. 672). https://www.wiley.com/en-sg/Viscoelastic+Properties+of+Polymers%2C+3rd+Edition-p-9780471048947
Gizzi, V., & Bennison, S. J. (2009). New Marine Glazing Developments. Glass Performance Days 2009, 149–151. http://www.glassfiles.com/library/article.php?id=1392
International Organisation for Standardizarion. (2019). ISO 11336-3: Large yachts - Strength, weathertightness and watertightness of glazed openings - Part 3.
International Organisation for Standardizarion. (2020). ISO 11336-2: Large yachts - Strength, weathertightness and watertightness of glazed openings - Part 2.
International Organisation for Standardizarion. (2021). NBN ISO 37: Rubber, vulcanized or thermoplastic — Determination of tensile stress-strain properties.
International Organisation for Standardizarion. (2023). ISO 11336-1: Large yachts - Strength, weathertightness and watertightness of glazed openings - Part 1.
Moupagitsoglou, K. (2020). Structural Glass in Superyacht Applications: Overcoming Challenges, Design Standards and Analysis Methods. Proceedings of Challenging Glass 7 Conference on Architectural and Structural Applications of Glass.
Verbaas, F. (2012). Use of Glass and the Regulations. Proceedings of the 22nd International HISWA Symposium on Yacht Design and Yacht Construction.
Wium, D., Lataire, E., & Belis, J. (2023). Finite element analysis of a glass structure in a superyacht superstructure. Glass Structures & Engineering Engineering, 8, 549–566. https://doi.org/10.1007/s40940-023-00240-1


 demonstrator at Glass Technology Live during Glasstec 2024 (© Cas Maertens).")