Source: Glass Structures & Engineering
Authors: Lena Efferz, Steffen Dix, Christian Schuler & Stefan Kolling
DOI: https://doi.org/10.1007/s40940-024-00285-w
Abstract
Minor fluctuations in the tempering process of architectural glass lead to residual stress differences resulting in birefringence and undesired optical iridescence, also known as anisotropy effects. The control of anisotropies, which are quantified as optical retardation, is limited to monolithic glass. In modern architecture, laminated glass panes consisting of an interlayer of polyvinyl butyral or ionomer (SentryGlas®) are frequently applied. In this paper, photoelastic studies are performed on laminated glass panes before and after the lamination process to evaluate their effect and to investigate the influence of the superposition of different orientated glass panes. An influence from the interlayer is not markedly evident. Aside from a few outliers, there are percentage deviations of less than 6% in the 95% quantile value. The influence of the retardation pattern of the individual sheets is significant; depending on their position in the furnace, the superposition of the individual glass sheets results in a dot-shaped or a strip-shaped pattern. The experiments have demonstrated that retardation can be cumulative or reduced depending on the azimuth angle of the individual retardation value. Finally, six glass panes were installed in an outdoor test rig to observe the optical appearance under various light condition and different viewing points. Here, a correlation of the findings from the previous retardation measurements is clearly revealed.
1 Introduction
1.1 Motivation
Modern urban landscapes are now characterized by exceptional building envelopes featuring heat-treated glass panes. Due to their superior strength and thermal shock resistance compared to annealed float glass, they are the preferred choice. Heat-strengthened glass (HSG) increases strength by approximately 1.6 times, while fully tempered glass (FTG) achieves a factor of about 2.7. This enhanced strength allows for the design of lighter structures, reducing CO2 emissions by utilizing thinner glass and slimmer steel and aluminium profiles.
Architectural glass demands maximum transparency, yet the standard tempering process introduces minor fluctuations in lateral stress distribution, leading to birefringence and unwanted optical iridescence, commonly known as anisotropy effects.
Optical anisotropy, akin to natural crystal properties, emerges in glass due to induced stress birefringence. These optical phenomena can become visible as a characteristic pattern in the facade in the form of grey, white or rainbow-colored spots, rings or stripes under certain light incidence, weather conditions and daytimes, see Fig. 1. Despite not being classified as a defect, architects, building owners, facade consultants, and increasingly, occupants, perceive these anisotropy effects as visual disturbances.
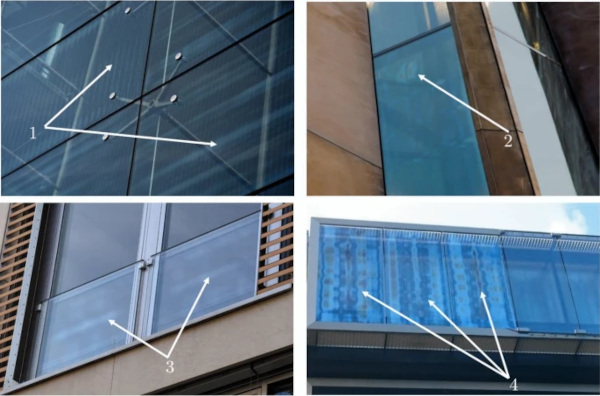
The knowledge on this topic has been greatly enhanced in recent years (Illguth et al. 2015; Schaaf et al. 2017; Maccariello and Hivet 2022; Dix 2024). However, there is still a lack of understanding regarding anisotropic effects in laminated glass and in insulated, coated glass units. This study aims to provide initial insights for laminated glass.
1.2 State of the art
In response to the need for anisotropy-free glass (Henriksen and Leosson 2009; Pasetto 2014), the further development of digital photoelasticity and the introduction of commercial anisotropy scanners, ASTM 1901 and DIN SPEC 18198 (2022) were developed. These regulate the measurement (ASTM C 1901 2021), as well as the measurement and evaluation (DIN SPEC 18198) of monolithic heat-treated glass. The limit values and quality classes used in DIN SPEC 18198 are based on retardation measurements analyzed in the research project (Schuler et al. 2022) and in Dix (2024). The results of the monolithic test specimens demonstrated a discernible impact of the glass thickness and position within the tempering furnace on the pattern and level of the measured retardation.
The measurement of retardation in monolithic glass panes can be easily implemented by glass processors due to the straightforward integration of anisotropy scanners at the outlet of the tempering furnace. If a certain level of anisotropy quality is not reached it can be easily sorted out. Consequently, the measurement of laminated glass panes is unusual, which is why no panes of large component size have been used for these investigations to date.
However, Dix et al. (2022b) investigated laminated small-format samples and the influence of polymer interlayers. To assess the photoelastic behavior of the interlayers, the photoelastic constants C for two interlayers polyvinyl butyral (PVB) and ionomer SG (SentryGlas®) were determined in a tensile test under constant load. In comparison to glass the polymer interlayers show a significantly higher photoelastic sensitivity (see Table 1). The results of the retardation measurements of the laminated samples with SG and PVB showed no recognizable difference. On the other hand, the comparison between the test specimens without and with an interlayer resulted in an increase of up to 18% for the 1000 mm × 1000 mm test specimens. As the retardations are dependent on the format and size, no statement could be made for a transfer to large-format panes as typically used in glass structures.
1.3 Research questions
In this study, heat-treated panes of 1000 mm × 3000 mm are first measured individually, then in superposition before and after the lamination process using a full surface anisotropy scanner. Selected panes are then installed in an outdoor test rig to evaluate the anisotropy effects under real light and viewing conditions. Finally, a group of participants will be interviewed to assess the quality. The following questions arise from the aforementioned problems, which are to be answered in this paper:
- Can an influence from the interlayer (SG and PVB) or the lamination process be detected in the measurement results?
- How does this compare with small format samples from Dix et al. (2022b)?
- What influence do the combinations of the different orientations of the glass in the tempering furnace have on the retardation pattern of the laminated glass?
- How do the retardation patterns and values of the measured laminated specimens differ from the prediction from the addition of two single panes?
- Is there a correlation between the measurement and the visible anisotropy effects for laminated glass?
- Can the findings from Dix (2024) be confirmed with regard to visual evaluation?
2 Methods
2.1 Test specimens
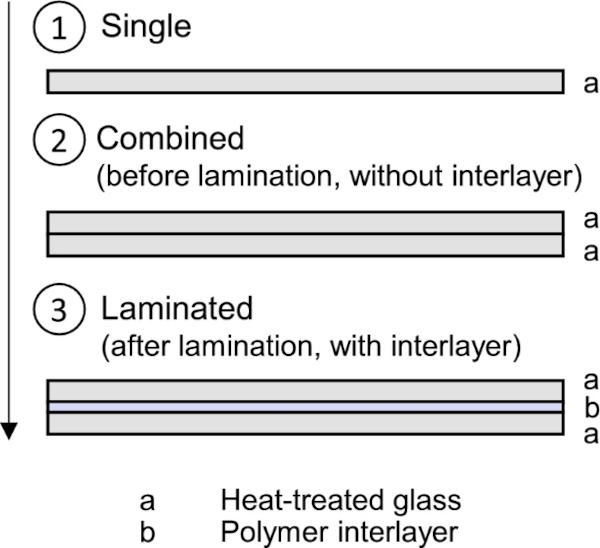
The test specimens (1000 mm × 3000 mm), produced by three manufacturers from the same base glass, comprised the prestress levels of fully tempered and heat-strengthened glass. The photoelastic measurements were carried out in a three-step procedure which is shown in Fig. 2. First, the heat-treated monolithic panes were investigated individually (1), then two specimens without interlayer (2) and finally with interlayer (as laminated safety glass) (3).
During the prestressing process, four specimens were always tempered simultaneously. Three glass panes were placed longitudinally and one glass transversely in the direction of movement of the tempering furnace. The aim was to investigate the influence of the position on the retardations of different oriented laminated panes. Figure 3 shows the retardation images (false color plots with range from 0 to 200 nm) of the individual panes which are assigned to their position in the tempering furnace. The three longitudinal specimens form a strip depending on the direction of movement, while the transverse glass shows a diffuse punctual pattern of retardations.
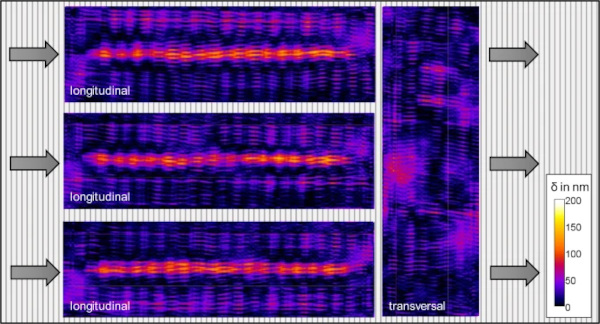
Table 1 Photoelastic constants C - Full size table
Based on the 44 individual panes, 22 pairs of panes without interlayer were examined, 19 of which were produced as laminated glass. To investigate whether the retardation patterns of the different orientated single panes intensify or compensate each other, longitudinal-longitudinal panes and longitudinal-transverse panes were combined during the lamination process. The laminated glass was produced with the interlayers PVB with roller pre-lamination and SG using the vacuum bag process in an autoclave. The manufacturers each used the same type of interlayer with a thickness of 1.52 mm. Table 2 shows an overview over the specimen matrix.
Table 2 Overview parameter with number of laminated specimens - Full size table
2.2 Photoelastic measurements
Stress optical methods (Aben and Guillemet 1993; Ramesh and Sasikumar 2020; Dix 2024) are used to measure anisotropy effects in glass. This study utilized the measurement approach of multiple wavelength photoelasticity which evolved from half-wavelength photoelasticity (Voloshin and Burger 1983). So, the measurement range is no longer limited to retardations up to half a wavelength and retardations up to a whole fringe order can also be measured using simultaneously generated isochromatic images (Hidalgo and Elstner 2018; Dix et al. 2022a). The measuring device (Softsolution GmbH 2023) uses the setup of a circular polariscope in bright field with two wavelengths (blue and green) to measure retardations up to 250 nm. The accuracy and repeatability of the measuring device was examined in detail in Dix (2024). An average deviation of 5 nm was found with the author’s device, which is in accordance with DIN SPEC 18198 (2022).
As a result of the higher retardation levels observed in the edge and corner areas of the glass, it was appropriate to divide the pane into evaluation zones in accordance with the specifications set out in DIN SPEC 18198. The subsequent evaluation is carried out with zone M, in which the area on the long side was reduced by 600 mm and on the short side by 200 mm. A variety of analytical techniques are available for examining retardation images, including the texture and 95% quantile value method (Dix et al. 2021). In this study, the 95% quantile method x95 was used, which takes into account the distribution of retardation and describes the value below, which 95% of all values fall.
2.3 Observations in the outdoor test rig
The appearance of optical anisotropy effects is influenced by various viewing conditions, e.g. position of observer, position of the sun, state of light polarization, background and disturbances in the reflectance image of the observed glass, c.f. Dix (2024).
Based on his studies, a series of observational studies on the visibility of anisotropy effects in tempered glass are performed at the outdoor test rig at the university of applied sciences. To investigate the anisotropy effects in relation to real lighting conditions and the perception of the human eye, five laminated samples were installed in the test rig. The 5 m x 4 m steel profile test stand consists of a 360° rotatable column jib crane with a facade surface consisting of movable mullions and transoms (Dix et al. 2022c, Dix 2024). Figure 4 shows the test rig with a curtain as a dark background and the installation position and labelling of the tested panes.
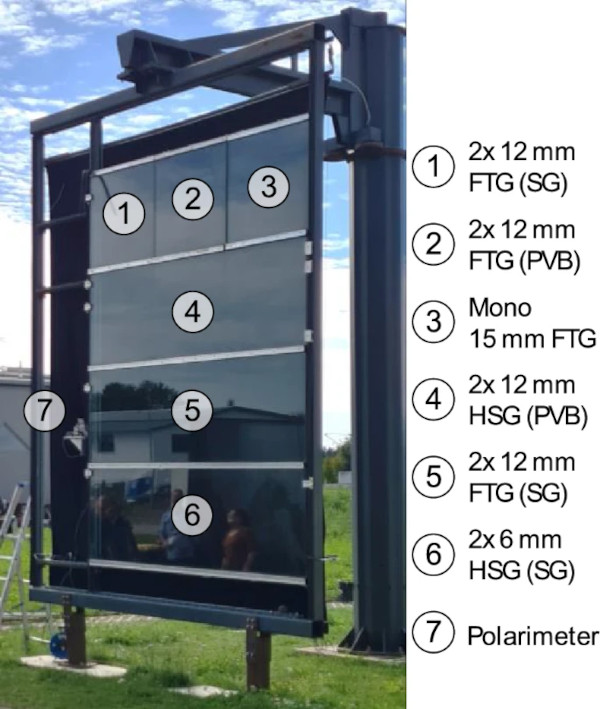
The observation and subjective evaluation of the anisotropy effects on the laminated specimens was carried out by ten members of the German “Façade Technology” working group of FKG (Fachverband Konstruktiver Glasbau e.V.).
The design of the observations was based on the concept presented in Dix et al. (2022c). Different observation situations were determined depending on the orientation of the test stand, the viewing angle, if polarizing filters were used and the times of observation, see Table 3. The viewing distance to the façade was 1.5 m.
Table 3 Observation situations depending on sky direction, viewing angle, polarizing filter and time - Full size table
For each situation, the observers were asked to rate the anisotropy effects on a scale of 1 to 5:
- 1—none recognizable
- 2—barely recognizable
- 3—recognizable
- 4—very noticeable
- 5—very disturbing
In order to evaluate the observation of anisotropy effects depending on the degree of polarization of the sky, the polarization of the incident light was measured and calculated using a self-constructed polarimeter according to Abayaratne and Bandara (2017) with rotatable optical analyzers.
The polarimeter measures the incident light intensities in 6°steps from 0° horizontally to 90° vertically over the sky. The polarizer rotated in each position in 11° steps to 180°, so a sinusoidal curve is created. The min and max intensity values result in the Stokes parameters S1, and S2 with which the linear degree of polarization p and its angle theta can be calculated, see Dix (2024).
The visibility of anisotropy effects depends on the viewing angle. The so-called Brewster angle describes the angle at which the reflection of the incoming light becomes zero and the light waves have the highest degree of polarization. Consequently, the anisotropy effects in façades are particularly noticeable at the Brewster angle. The evaluation of the polarimeter parameters was carried out for the polarimeter position of 56°, equal the Brewster angle (56°), as specified in Dix (2024) corresponds approximately to this measurement angle.
3 Results of the photoelastic measurements
3.1 Evaluation of the single panes
Figure 5 illustrates the 95% quantiles of the single panes. Samples positioned longitudinally to the transport direction in the tempering furnace exhibited higher values than those positioned transversely in the furnace. As illustrated in Fig. 3, this phenomenon could be observed in the remaining retardation images. Longitudinally positioned samples exhibited a striped pattern with high retardation, while transversally positioned samples exhibited a spread dot-like pattern.
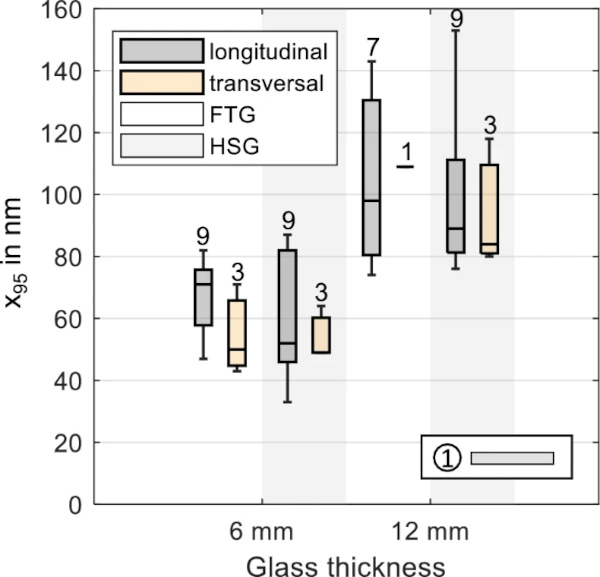
The FTG and HSG prestress levels exhibit only minor differences. In contrast, as expected, there is a strong dependence on glass thickness. The single panes would be classified as quality class A and B according to DIN SPEC 18198.
3.2 Evaluation of the combined samples without interlayer
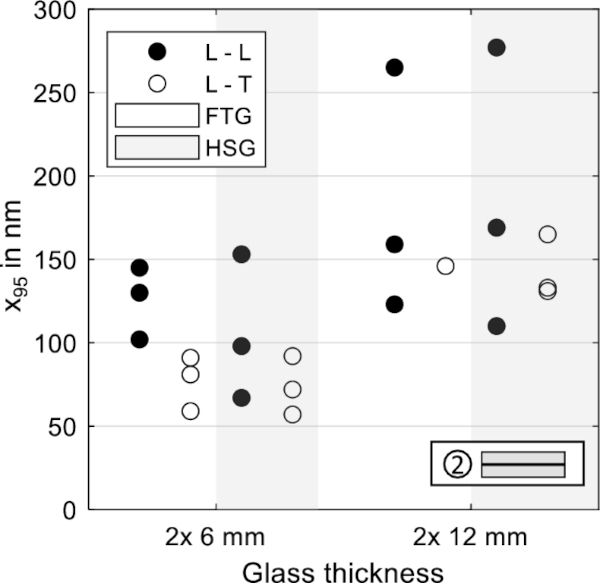
Figure 6 shows the results of the overlaid panes without interlayer. The pane bundles consisting of two longitudinal single panes (L–L) achieve higher retardations than the pane bundles with one longitudinal and one transversely (L–T) aligned panes. This suggests that two different orientations have a more favorable effect on retardations. There is no difference between FTG and HSG.
3.3 Evaluation of the laminated samples with interlayer
Figure 7 shows the results with of the laminated panes divided in the interlayer. In general, the specimens with SG tend to achieve higher values than those with PVB, but the dependency of the laminated orientations are disregarded.
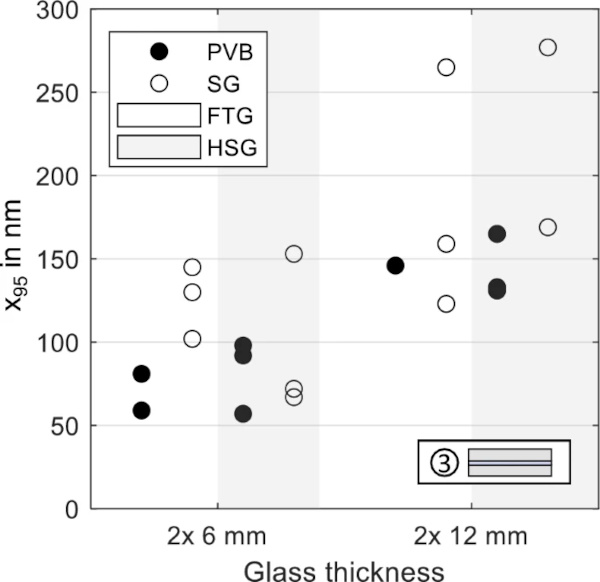
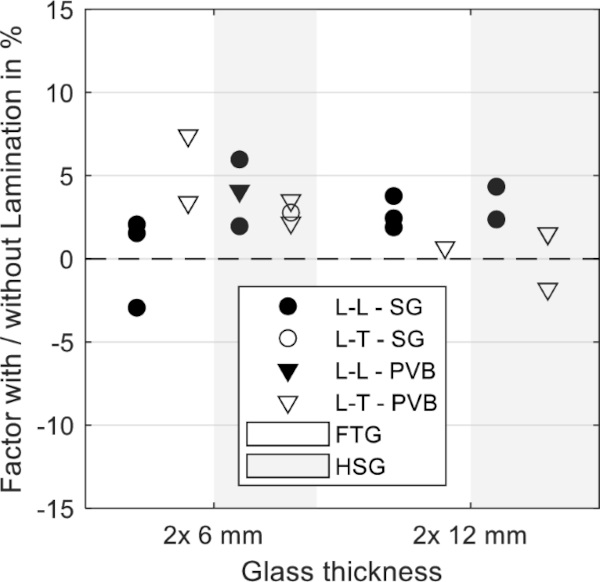
So, to investigate the influence of the interlayer in more detail, the ratios of the 95% quantile of the laminated sample with interlayer to the combined sample without lamination were formed.
As the ratios in Fig. 8 show, two laminated test specimens (L–L with SG and L–T with PVB) achieve lower values than the composite test specimens without lamination. The average influence of the interlayer in the laminated pane bundle is approx. + 5% and can therefore be disregarded as negligible while the influence of the laminated orientation is higher.
3.4 Superposition of the single panes
This chapter examined the superposition behavior of the single panes. In other words, it will be analyzed whether the retardations of the laminated pane can be predicted from the two added retardation images of the single panes. For this purpose, the measured retardation values of the single panes are added at their overlapping position.
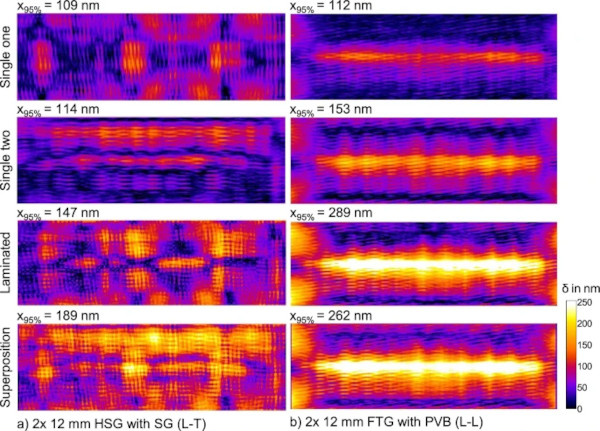
Figure 9 shows an example of the retardation images (false color plots) of the two single panes, the laminated pane with interlayer and the result image of the super positioned single panes including the 95% quantile value.
The diagram in Fig. 10 shows the ratio of the 95% quantile values between the laminated and the super positioned samples on the y-axis:
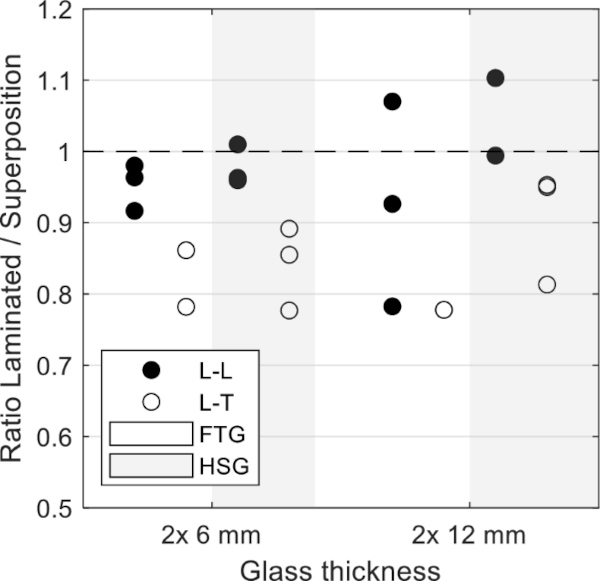

All test specimens containing single panes of both orientations (L–T) achieve lower values in the real measurement of the laminated pane than the added single panes. It can therefore be assumed that the patterns depending on the different orientation of the single panes partially compensate for each other.
In comparison, specimens laminated with the same orientation (L–L) are more likely to achieve the super positioned value. For some 2 × 12 mm specimens, it can even be observed that the real measured retardations exceed the added values of the super positioned specimens, regardless of the prestress level.
An accurate prediction of the retardations for a combined samples is not possible simply by adding the retardations of the single panes. The authors suspect an influence of the azimuth angle, which describes the orientation of the principal stresses but cannot be recorded with the measuring device used.
4 Field study—observations and measurements on the outdoor test stand
4.1 Evaluation of the visible anisotropy effects
The images presented in Fig. 11 were captured by the participants without the use of polarizing filters. The false color plots on the Michel-Levy scale are displayed below the photos for comparison between laboratory measurements and real observation. The 95% quantiles of the measurements are also shown on the right.
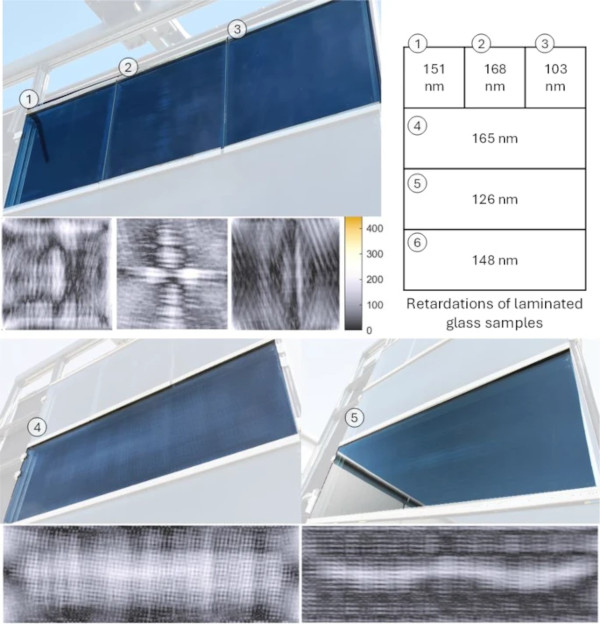
Due to the low positioning of test specimen 6, the reflection from the nearby building disturbs the representation of the anisotropy effects in the image, which is why test specimen 6 is not shown in the photo. The effects of the retardations from the false color plots can be clearly seen as visible anisotropies, as shown in Fig. 11 and confirmed by the participants.
Figure 12 shows the subjective evaluation of the anisotropy effects as mean value and min and max values of the interviewees.
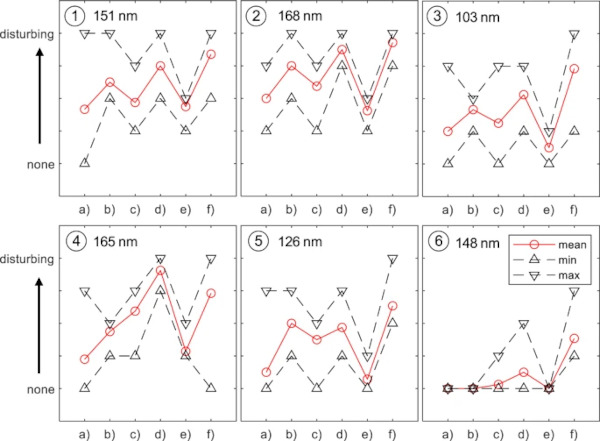
In the case of sample 1, the participants were particularly disturbed by the stripe on the right-hand edge. The characteristic pattern in sample 2 was readily apparent in all observation situations. The combination of the longitudinal and transverse orientations of the panes in sample 4 was visible as a diffuse field in the center of the pane. In the image of sample 5, the reflection of the building can be seen in the bottom left-hand corner. However, the striped pattern was clearly discernible when evaluated from multiple viewpoints.
Due to its low position in the test stand, test specimen 6 was rated as the pane with the lowest anisotropy effects. Without the use of polarizers, the participants were unable to identify any patterns, although both individual panes can be classified as belonging to class B in accordance with DIN SPEC 18198.
The reduction in the evaluation of observation situation e) at 2 pm can be attributed to two factors: the differing orientation of the façade and the higher cloud cover in the afternoon. The reflection of clouds in the panes significantly limited visibility of the anisotropy effects.
4.2 Evaluation of the degree and orientation of the polarization of the sky
Figure 13 shows the recorded Stoke parameters S1 and S2 as well as the degree of polarization (left y-axis) with its orientation θ (right y-axis). The degree of polarization p of the incident light decreases towards midday in the western orientation. While the parameter S1 shows a larger increase, S2 has a more constant course. The orientation of the polarization θ increases sharply in magnitude and reaches its highest value at midday. The observation situations c and d take place under the same evaluation conditions, i.e. with a free choice of view and without a polarizer. Nevertheless, the participants assessed the anisotropy effects differently at the different times. The most anisotropy effects without a polarizer were observed at 11:59 AM (observation situation d), which is associated with a in magnitude maximum θ angle of 27°.
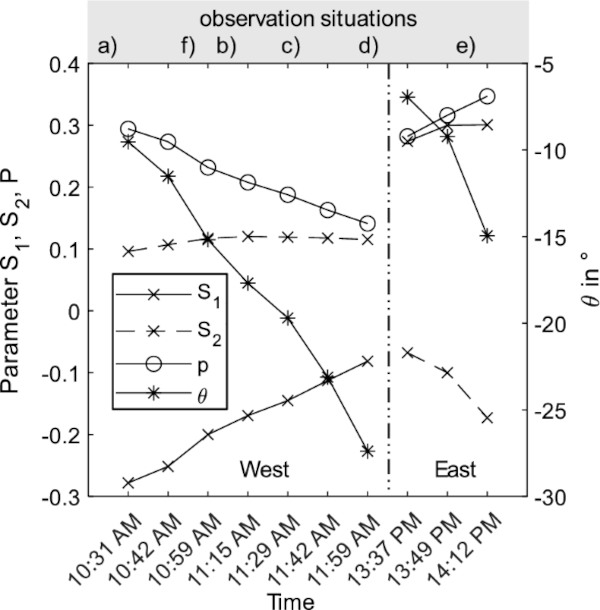
Therefore, the observation by Dix (2024) that not only the degree of polarization p is responsible for the increased visibility of anisotropy effects, but much more depends on the orientation of the linear polarization, can be confirmed. The orientation of the façade and the position of the sun also influenced the visual appearance of the anisotropies. After rotating the test stand so that the orientation corresponds to the east, the signs of S1 and S2 were reversed. The cloud cover increased towards the afternoon, limiting the visibility of the anisotropy effects.
5 Conclusion
The glass industry now has a growing awareness of the evaluation and control of anisotropy phenomena in monolithic glass panes due to various literature and technical standards. As the knowledge about laminated glass was still limited until then, due to the more complex measurement, which cannot be implemented in the production process, the influences from the interlayers and the superposition of two tempered glasses were investigated in this paper.
The comparison of anisotropy scans of overlaid and laminated glass revealed that the influence of the interlayer is not significantly pronounced. Apart from a few outliers, percentage deviations of 5% were observed for both investigated interlayers.
The superposition of the individual panes showed that the same orientations (L–L) tend to increase the visibility of this longitudinal pattern. To prevent this, a combination of different orientations would be recommended. The influence of the patterns of the single panes is significant; depending on the position in the furnace, the superposition of the single panes results in a dot-shaped or a stripe-shaped pattern. Retardations can accumulate or be reduced. Especially with thick glass, it is therefore recommended to be aware of the combination of different anisotropy patterns during lamination.
Furthermore, an attempt was made to predict the retardations of the laminated pane from the two added retardation images of the single panes. With two exceptions, the real measured 95% values of the laminated panes were lower than the addition of two single panes. The retardation images resulting from the addition of the single scans did not match the actual measured images either. It is not possible to accurately predict the retardation images for a laminated pane simply by adding the retardations of the single panes. The authors suspect an influence of the azimuth angle, which describes the orientation of the principal stresses but cannot be recorded with the measuring device used.
Following the measurement of the laminated glass, five test specimens were installed in the outdoor test stand and assessed by the FKG’s “Facade Technology” working group. There were various observation situations and points in time for the assessment. A good correlation was recognised between the measured retardation images and the visible anisotropy effects for the laminated glass samples.
The installation and observation situation exerted a considerable influence on the visibility of the patterns. The anisotropy patterns of a class B sample, assessed in accordance with DIN SPEC 18198 was found to be barely visible, due to its installation.
Without polarizing filters, the most disturbing visible anisotropy pattern were observed at noon and when the sun was perpendicular to the façade. The degree and orientation of the polarization of the incident light were also measured. The maximum anisotropy patterns were observed at a low degree of polarization but with a high orientation θ. This confirmed the findings of Dix (2024).
To obtain a good prediction of retardations for laminated glass from the two single panes, the influence of the azimuth angle must be considered with an appropriate measuring device in further studies.




Comments
Very good post, thanks a lot for sharing. Do you happen to have an RSS feed I can subscribe to? building and pest report ryde
A good reminder: small, unseen forces can shape outcomes in powerful ways. Civil plant & Machinery auto glass