Article Information
- Digital Object Identifier (DOI): 10.47982/cgc.9. 529
- Published by Challenging Glass, on behalf of the author(s), at Stichting OpenAccess.
- Published as part of the peer-reviewed Challenging Glass Conference Proceedings, Volume 9, June 2024, 10.47982/cgc.9
- Editors: Christian Louter, Freek Bos & Jan Belis
- This work is licensed under a Creative Commons Attribution 4.0 International (CC BY 4.0) license.
- Copyright © 2024 with the author(s)
Authors:
Paul Müller ᵃ, Christian Schuler ᵃ, Jakob Grötzner ᵃ, Steffen Dix ᵃ,ᵇ, Stefan Hiss ᶜ
ᵃUniversity of Applied Science Munich, Institute for Material and Building Research, Munich, Germanymueller.paul@hm.edu
ᵇJosef Gartner GmbH, Gundelfingen, Germany
ᶜKuraray Europe GmbH, Advanced Interlayer Solutions Division, Troisdorf, Germany
Abstract
With the continuing architectural trend toward transparent structures, the use of glass in the construction industry has increased significantly in recent years. The characteristic brittle failure behavior of glass is counteracted by the use of Laminated Safety Glass (LSG) in order to meet the safety-related requirements for breakage, post-breakage, and residual load-bearing capacity. For LSG, at least two panes of glass are laminated to form a monolithic composite with a polymer interlayer. During the manufacturing process, geometric imperfections ("planarity deviations" or "roller waves") in the thermally toughened glass can lead to permanent tensile stress in the thickness direction of the laminate.
This stress, especially under environmental conditions (humidity and temperature), has not been considered in current quality assurance measures or scientific studies on the structural performance of laminated safety glass. This paper analyzes the performance of PVB composite samples under tensile load in the thickness direction of the laminate. Two PVB products are considered under two environmental conditions. Based on quasi-static tensile tests to determine a primary strength, the influence of load duration is analyzed in creep tests at different load levels. On the one hand, a relevant correlation between load level and failure time could be determined. Firstly, a relevant correlation between load level and failure time was established. Secondly, a relationship between quasi-static strength and creep performance is observed and a model for predicting the failure time of such specimens is proposed.
1.Introduction
1.1. Motivation and problem statement
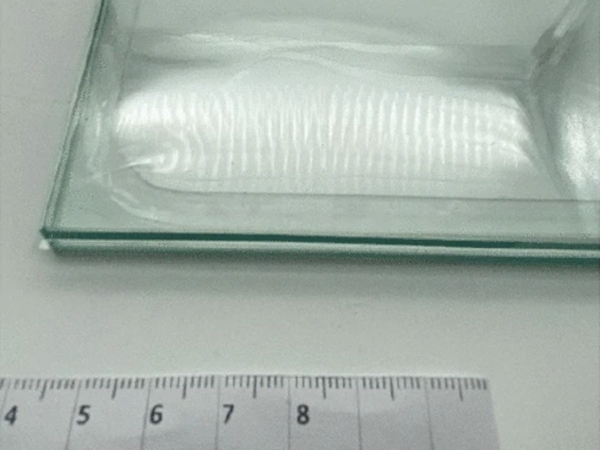
With the continuing architectural trend towards transparent structures, the use of glass in the construction industry has increased significantly in recent years. The characteristic brittle failure behavior of glass is counteracted by the use of Laminated Safety Glass (LSG) in order to meet safety requirements with respect to breakage, post-breakage, and residual load-bearing capacity. For LSG, at least two panes of glass are laminated to form a monolithic bond with a polymer interlayer. In this way, glass fragments resulting from breakage can be bound and a residual load-bearing capacity of the glazing can be achieved. The bond between the glass sheets and the interlayer has a decisive influence on the functionality of the building product and therefore on its safety. With a good bond, fragments of broken glass adhere to the interlayer and a residual load-bearing capacity can be achieved. LSG is used in the construction industry as safety glazing, accessible glazing, horizontal glazing or as a glass component. Despite extensive quality assurance measures and extensive experience in the manufacturing process, damage to LSG units is found in various constructions. These include delamination phenomena, as shown in Fig. 1.

Delamination is often the result of several factors. The choice of interlayer and interlayer thickness is just as important in preventing delamination as the quality of the individual components and the manufacturing process of the LSG. Adequate in-house production control and adherence to relevant processing guidelines are also essential. In addition, further processing into laminated glass may well require tighter tolerances than those described in the relevant product standards for monolithic applications. Previous studies on the strength and delamination behavior of LSG have only addressed delamination behavior under short-term loading or strength behavior under shear loading.
One possible parameter influencing the development of delamination is the quality of the glass used, in particular its flatness. (DIN EN 12150) regulates the requirements for the basic thermally toughened safety glass, and (DIN EN 1863) for heat strengthened glass. A distinction is made between overall bow, distortion due to rolling waves, and edge lift. However, neither set of regulations contains any information on the limit values for flatness during further processing into laminated safety glass. Depending on the arrangement of the initial glass prior to lamination, advantageous or disadvantageous geometric combinations may result, as shown in Fig. 2. Existing gaps are filled during the laminated glass manufacturing process by pressing the glass together. Some of the existing waviness may be absorbed by the polymer interlayer during the lamination process. For this reason, the use of thicker interlayers is recommended when producing complex geometries. After the autoclave process, the clamping of the glass is removed. The remaining waviness then leads to a restoring force, resulting in a permanent tensile stress in the thickness direction on the interlayer. This stress, caused mainly by imperfections, has not been recorded in previous studies, but can have a significant influence on the delamination behavior of laminated safety glass, especially due to the permanent stress.

1.2. State of the art
The following test methods are currently available for testing mechanical glass adhesion: Pummel test (TROSIFOL 2012, Schuster et al. 2020), compression shear test (Jagota et al. 2000, TROSIFOL 2012), torsion test (TROSIFOL 2012), peel test, shear test, VW pull test, through-crack tensile test (TCT) (Franz 2015), pendulum impact test or ball drop test. These quality assurance tests are only partially combined with artificial aging tests. The structural performance of LSG made of PVB has been investigated by analyzing the effects of artificial weathering caused by UV radiation, high temperature and high humidity as well as cyclical continuous loading, e.g. in (Schuler 2003, Schuler et al. 2004, Ensslen 2005, Sackmann 2008). (Kothe 2013) dealt with the influence of artificial aging of different interlayers by elevated temperature, storage in different climates, corrosion tests and irradiation tests. Different ways of simulating LSG in the intact and fractured state are investigated in (Drass et al. 2018, Schuster et al. 2018, Brokmann et al. 2019, Brokmann et al. 2021, Müller-Braun et al. 2021, Pauli et al. 2021). The influence of artificial aging by thermal cycling, high temperatures and humidity on pure interlayer material was investigated in (Centelles et al. 2020). Experiments on creep behavior under continuous shear stress and high temperature are presented in (Schimmelpenningh 2019). The delamination behavior of LSG was investigated in (Butchart and Mauro 2012, Chen et al. 2021, Chen et al. 2022). However, the focus of these studies was mainly on the analysis of the residual strength of fractured LSG.
The literature presented here shows the influence of the type of load and environmental conditions on the interlayer or laminate. On this basis, indications can be obtained to evaluate the relevance of different influencing factors. However, possible uncertainties from the manufacturing process of the LSG units and their individual components are not included in the investigations carried out, material properties are determined only on the pure interlayer material without bonding, and a combination of hygro-thermo-mechanical stress is not investigated. The mechanical stress caused by the manufacturing process in combination with harmful environmental influences has not yet been analyzed. The test results presented in this publication are intended to provide initial findings in this regard.
1.3. Scope and outline
This publication presents experimental studies on the time-dependent delamination behavior of laminated safety glass, taking into account environmental influences and different film types.
The aim of these investigations is to analyze the adhesion properties of different PVB films under continuous tensile load to investigate the influence of different climatic environmental conditions. The scientific questions to be addressed are
- What tensile strength can be achieved under quasi-static loading?
- What are the failure times as a function of load level in the continuous tensile test?
- What is the effect of environmental conditions on different interlayer types?
- Can the load carrying capacity be improved by using interlayers with enhanced adhesion?
2. Methodology of the test concept
2.1. Overview of the Research Performed
To answer the questions raised in the previous section, two different experimental tests, quasi-static and creep tests, are performed in this publication to analyze the delamination behavior of LSG under tensile loading in the thickness direction:
Quasi-static tensile tests were performed on composite specimens to analyze the load-bearing behavior under short-term loading. The fracture stress 𝜎𝑞s,ult determined from these tests forms the basis for the loading of the creep tests. Based on the respective mean values 𝜎𝑞s, the permanent tensile stress 𝜎creep was determined for the creep tests for the respective load levels (LL ), as described in equation (1). The tensile creep stress 𝜎creep determined in this way was applied to the specimen to investigate the long-term load-bearing behavior.
![]()
2.2. Environmental and climatic conditions
In order to analyze the influence of different environmental and climatic conditions, a test at elevated temperature, 50 °C, and elevated humidity, 80 % RH, (50|80) was performed in addition to the room climate (RT) experiment. The glass transition temperature of PVB is in the range of approx. 40 °C, according to (Kraus et al. 2018), so the testing temperature was selected above.
Due to the different experimental setups, it was not possible to ensure exactly the same climatic ambient conditions in the quasi-static and creep tests. In the quasi-static test, it was not possible to control the room humidity due to the experimental conditions.
To ensure complete preconditioning of the specimens in the elevated climate tests, all specimens were stored in a climate chamber for 7 days and individually removed and tested for the static tests. In the creep tests, the load was applied after the preconditioning period. The exact test and preconditioning conditions for temperature and humidity (RH) are defined in Table 1.
Table 1: Summary of the climatic test and preconditioning conditions.

2.3. Interlayer materials used
In this publication, two different PVB interlayers from Kuraray with a nominal thickness of 0.76 mm were analyzed. In addition to a standard product “Clear” (C) with normal adhesion properties, an interlayer with enhanced adhesion properties “UltraClear” (UC) was analyzed. The UC interlayer hasincreased values for typical material characteristic describing the adhesion like pummel values and compressive shear strength. The detailed material characteristics for the interlayers analyzed are shown in Table 2.
Table 2: Overview of the interlayer tested with typical material characteristic value.

2.4. Test matrix
In the quasi-static tests performed to determine the reference stress 𝜎𝑞s, 5 samples were tested at RT for each interlayer. This number of specimens gives a good indication of the variation within the series and allows initial statistical evaluation. In the 50|80 test series, only 3 specimens were tested due to low scatter. In the creep tests, 3 specimens were tested for each parameter combination tested. A complete experimental parameter combination was not performed at all load levels. The final test matrix with the number of samples tested is shown in Table 3.
Table 3: Final test matrix including number of samples tested.

2.5. Manufacturing specimens
In order to analyze the delamination behavior of LSG, test specimens of the two glasses in combination with the interlayer were manufactured as part of this publication to determine the load-bearing behavior. Since the direct production of small test specimens from LSG is very costly, cylindrical test specimens with a diameter of 30 mm were produced from larger LSG elements by water jet cutting. The LSG elements were produced from 6 mm thick float glass with appropriate interlayers in the laboratory facilities of Kuraray Europe GmbH and provided to the Munich University of Applied Sciences (HM). Steel cylinders with the same diameter and a threaded hole were fabricated to connect the LSG cylinders to the load string of the test setups. The drill cores were bonded to these cylinders using a high strength 2K epoxy adhesive. The final specimen is shown in Fig. 3a. Bonding was performed using a specially designed fixture to ensure centric bonding with defined adhesive layer thicknesses, as shown in Fig. 3b. The top of the fixture can be moved in the direction of the arrows to apply the adhesive. Final fabrication of the specimens was performed in the HM.

2.6. Experimental setups
The quasi-static tests were performed on an Instron 5982 - 100 kN universal testing machine. The load was applied in tension in the thickness direction of the laminate. To ensure centric load application, the specimens were integrated into the load line of the machine via a threaded rod as shown in Fig. 4a. The test setup can be placed in a temperature chamber to perform tests at elevated temperatures. Tests were performed under deformation control at a test rate of 1.5 mm/min until specimen fracture.
The room temperature creep tests with high load levels and comparatively short failure times were also performed in the universal testing machine. For this purpose, the desired load was applied to the specimen with the testing machine as a force-controlled continuous load. All other creep tests were performed in specially designed test stands based on the principle of a beam balance, as shown in Fig. 4b. The load could be varied by changing the counterweight and the lever arm. The respective load levels were calibrated using a 5 kN force transducer type "HBM S9M/5kN", which could be mounted in the load line of the frame instead of the test specimen, and the counterweight was then adjusted. The creep tests were monitored using strain gages and HBM WA-T 20 inductive displacement transducers (LVDTs). A total of 2 strain gages were attached to the test setup for each specimen.
One on the top of the lever arm at the point of maximum torque and one on the threaded rod of the load application. The locations of the measurement equipment are also shown in Fig. 4b. The measurement data was recorded using the HBM - Catman easy software. For the tests at room temperature, an "HBM - QuantumX 1516b" was used as the measurement amplifier for the strain gauge measurements and an "HBM - QuantumX 840b" for the displacement measurements. The tests in the climatic chamber were monitored with an HBM - MGCplus amplifier. For testing at the 50|80 ambient climate, the test stand was designed to be placed in a climatic chamber as shown in Fig. 4c.

3. Results of the quasi-static investigations
To describe the test procedure, the load-deformation curves of the exemplary test series of film type "C" at RT are shown in Fig. 5a. The 5 specimens fail at loads ranging from 6.2 to 7.4 kN with crosshead travel of the testing machine ranging from 1.7 to 2.1 mm. In preliminary tests, it was found that due to the high stiffness of the specimen or intermediate film, the deformation was almost entirely due to deformation of the test structure.
To determine the reference tensile stress 𝜎𝑞s, the mean values of the breaking stresses from each series are determined and plotted as a bar graph in Fig. 5b, including the minimum and maximum values. It can be seen that the series tested under increased climatic stress 50+ have only about 20% of the strength of the series tested under room climate. In addition, the use of the "UC" interlayer can increase the strength by 39% compared to the "C" interlayer under ambient conditions and by as much as 54% under elevated temperatures. Adhesive failure was observed in all samples regardless of film type and environmental conditions. The UC interlayer showed adhesive failure on both substrates at RT, while all other series showed failure on only one substrate.

4. Results of the creep tests
4.1. Determining failure times
The results of the creep tests were evaluated by determining the failure times 𝑡𝑓 of each specimen. Due to the irregular measurement signals, it was not possible to automatically evaluate the times for all specimens. The loading and fracture times of the specimens were determined by manually evaluating the strain and displacement measurements. The failure times were then determined from the difference between the loading and fracture times. Specimens in which the failure was not in the PVB interlayer but in the glass portion of the specimen or in the structural bond were defined as outliers and were not included in the evaluation. Samples where no failure could be detected at the end of the test period were included in the evaluation at that time and marked as no failure. As in the quasi-static tests, adhesive failure was observed in all samples in the creep tests. The UC interlayer showed a rougher failure pattern compared to the C interlayer.
4.2. Effect of load level
To illustrate the results of the creep tests, the failure times 𝑡𝑓 of each specimen are plotted as a function of the permanent tensile stress 𝜎creep. Fig. 6 shows an example of the results for the tests with interlayer C under standard room climate conditions RT.
It is clear that the disproportionately long failure times at low load levels from the linear representation in Fig. 6a make it difficult to represent influences in the low load or failure time range. According to (DIN EN ISO 899-1), the double logarithmic scale as shown in Fig. 6b is suitable for the representation of so-called creep-to-rupture curves. The course of the individual failure points thus approximates that of a straight line, which allows a mathematical description by means of a power function. The diagrams in Fig. 6 clearly show the dependence of the failure time on the load level. As the applied stress decreases, the failure time of the specimens increases significantly. For the series shown at room temperature, it can be seen that a critical range is reached at the lowest load level tested, where the failure time increases very sharply. For the series shown, the test was terminated after 49 days of loading.

4.3. Effect of environmental climatic conditions
A significant influence of the changed climatic conditions can be observed for both interlayer materials. Fig. 7a shows the two test series under room climate and increased climate stress 50|80 for the "Clear" interlayer, Fig. 7b for the "Ultra Clear" interlayer. Again, there is a clear correlation between the data points for all 4 series.
Regardless of the interlayer, it can be seen that for a constant failure time 𝑡𝑓, the applied tensile stress is higher under RT. The adhesion under the elevated climatic conditions of 50|80 decreases significantly.

4.4. Interlayer Effect
In order to investigate the influence of the type of interlayer on the delamination behavior of the LSG samples, the test series for the climatic ambient condition RT are shown in Fig. 8a and the series tested at 50|80 are shown in Fig. 8b.
For both climatic conditions, it can be seen that the failure time 𝑡𝑡𝑓𝑓 can be increased by selecting an interlayer with high adhesion. Again, the significant influence of the changed environmental conditions on the adhesion of the interlayers is evident. The influence of the changed environmental conditions is more pronounced than the influence caused by the changed interlayer. However, it should be noted that the tested environmental conditions of 50°C and 80% RH represent a very extreme situation for the small drill cores, as the long exposure time combined with the small sample means that complete moisture penetration can be assumed. This condition represents an unlikely extreme situation for standard glass pane sizes.

5. Determination of a failure model for LSG under continuous tensile loading
5.1. Correlation between quasi-static and creep tests
In order to get a comprehensive overview of all creep test results, the failure time tf of all specimens is plotted as a function of the permanent tensile stress σcreep in Fig. 9a. Within the test series, the linear relationship between failure time tf and σcreep is again evident. In addition, the influences of the analyzed parameters explained in the previous section are clearly visible.
The load in each series of tests was selected before the tests using equation (1) based on the results of the quasi-static tensile strength σqs. Therefore, in order to standardize the load, the failure time tfis shown in Fig. 9b as a function of the load level LL and thus in relation to σqs.
This clearly shows that all 4 series tested run on top of each other up to a failure time tf of approximately 20 hours or up to an approximate load level f20. From this point on, the series tested under the 50|80 climate conditions behave differently from the series tested under RT. For the series tested at 50|80, a significantly lower failure time tf is observed from LL f15. For the series tested at RT, with the maximum test times specified in these studies, no failure can be detected at LL f15 for the majority of the specimens. The failure times of the samples tested at elevated temperature and humidity of 50|80 still failed at LL f15 within a period of 11 to 20 days.
However, it is noticeable that the two series with the same climatic environmental conditions but different interlayers correlate well. The differences previously seen in Fig. 8 can therefore be easily reduced by standardization using the static reference strength σqs.

5.2. Creep-to-rupture curves to predict failure time
In order to be able to predict the failure times tf as a function of the interlayer type and the climatic environmental conditions, a prediction model is developed in the following section. This model should allow to estimate the failure times tf as a function of the load level LL of the quasi-static reference strength.
A similar correlation compared to the creep test in Fig. 9 can typically be found in the high-cycle fatigue behavior of steel structures, where the applied stress range S corresponds with the number of stress cycles to failure N. The fatigue behavior obeys the exponential law in equation (2).
![]()
On the double-log scale used, the data can be expressed as a straight line. The linear dependence of the number of cycles on the stress range can be expressed by equation (3) (Drebenstedt and Euler 2018).
![]()
In order to predict the failure time tf as a function of the load level LL, equation (2) is adjusted to obtain the relationship shown in equation (4). This follows the same mathematical principles and can also be represented as a straight line on a double logarithmic scale with a base of 10.
![]()
To determine the two parameters, a and m, a linear fit of the logarithmized data points was performed using the "LinearLeastSquares" method with the help of Matlab® software. Three different groupings of data points were selected as input data for the fitting. Since the influence of the different climatic environmental conditions was determined in particular in Fig. 9b, these data points were combined in each case. In addition, a fitting was performed on the entire data set. In addition to the linear regression, which calculates a mean value curve for all data, the statistical prediction interval or lower prediction limit with 95% confidence was determined based on (Drebenstedt and Euler 2018). The prediction interval with 95% confidence can be used as a surrogate for the one-sided lower 95% tolerance limit with 75% confidence. The R² value was used to assess the quality of the fit.
The results of the fits are shown in the form of regression curves in Fig. 9b. It can be clearly seen that the distribution of the data points over the two climatic environments allows a good representation of the individual failure points. The fit over the entire data set lies between the two curves and therefore allows only a rough estimate of the failure time, which loses accuracy. This is also confirmed by the R² values obtained, which can be found in Table 4. For very low failure times or high load levels, the curves for the different environmental conditions approach each other. Due to the small number of data points at high load levels, especially for the 50|80 test series, the application should only be carried out at load levels of less than 30%.
To simplify the interpretation of the fit results, the parameters LL₁₀ and LL₁₀₀ were determined for each model. These describe the load level LL at which a failure time tf_₁₀ of 10 h or tf_₁₀₀ of 100 h is reached. This shows that between the RT and 50|80 groups there is a reduction in LL₁₀ of about 30% and LL₁₀₀ of about 45%. However, it should be noted that this difference must be considered in addition to the existing difference from the determination of the quasi-static reference strength and that there is an additional decrease in adhesion. A summary of the model parameters used to determine the failure time is given in Table 4.
Using the determined model, it is now possible to calculate the failure time based on the selected stress level σcreep. As an exemplary comparison, the failure times for both investigated film materials are determined at a fictitiously selected stress of 3 MPa with the statistically evaluated 95% prediction intervals. Under room temperature, this results in a failure time of 1.1 h for interlayer C. For the interlayer with improved adhesion properties UC, the failure time under room temperature can be increased to 13.0 h at the same stress. However, the selected stress is not related to the actual stress that occurs in the component. Further investigation is required to determine this. It should also be noted that these statements are based on a limited number of specimens, so the results obtained need to be verified with further tests.
Table 4: Parameters to calculate the failure time in dependence of environmental condition and statistical evaluation interval.

6. Conclusions
As part of this publication, investigations were conducted to characterize PVB interlayers in LSG samples under tensile loading in the thickness direction of the laminate. The aim was to gain insight into the development of delamination phenomena due to imperfections. In addition to quasi-static tests to determine tensile strength under short-term loading, creep tests were also performed. In addition to two different interlayer materials, the effects of elevated temperatures of 50 °C and elevated humidity of 80 % RH were analyzed.
It was shown that under quasi-static loading there were differences between the two interlayers and the two climatic environmental conditions, with the effects of climatic loading being more pronounced. A reduction in strength was observed as a result of the increased climatic environmental conditions. In the creep test, a relevant influence on the failure time was determined by changing the load level of the continuous load. The relationship can be described as approximately linear on a double-log scale. The influence of the interlayer and the different climatic conditions could also be proven in the creep test. The specimens produced with the “UltraClear” interlayers with increased adhesion showed an increased load-bearing capacity compared to the standard “Clear” product. The evaluation of the creeptests on the basis of the load level LL showed that there is a relevant influence between the short-term strength and the load-bearing behavior under permanent load. A statistically validated prediction model was developed to predict fracture characteristics. This allows to predict failure times based on load level for the first time.
The results presented here provide the important insights for a more comprehensive understanding of the behavior of LSG under permanent tensile stress. In the future, this may help to elucidate the developmental processes of imperfection-related delamination. However, it should be noted that the investigations were carried out on a limited number of specimens and the results need to be confirmed by further investigations. In addition, two specific PVB-interlayers with different adhesion properties under specific hygrothermal conditions were tested, so it is not possible to extrapolate the results to alternative interlayers or hygrothermal conditions without further analysis. In addition to many alternative film materials and manufacturers, temperature and moisture exposure should be considered separately. A detailed analysis of the manufacturing process would be required to compare the predictive model proposed here with the stress applied to the component.
Declaration of generative AI and AI-assisted technologies in the writing process
During the preparation of this work the author used DeepL Write in order to improve the readability of the manuscript. After using this tool, the authors reviewed and edited the content as needed and take full responsibility for the content of the publication.
Funding
The Munich University of Applied Sciences was commissioned by Kuraray Europe GmbH to carry out delamination tests on LSG drill cores under climatic conditions. The investigations and the results presented here were carried out independently and without any influence from the client. In addition, the research was conducted in accordance with scientific principles.
References
Brokmann, C., Alter, C., Kolling, S. Experimental determination of failure strength in automotive windscreens using acoustic emission and fractography Glass Struct Eng 4(2), 229–241 (2019). doi: 10.1007/s40940-018-0090-9
Brokmann, C., Kolling, S., Schneider, J. Subcritical crack growth parameters in glass as a function of environmental conditions Glass Struct Eng 6(1), 89–101 (2021). doi: 10.1007/s40940-020-00134-6
Butchart, C., Mauro, O. Delamination in fractured laminated glass. In: Proc. 3rd Int. Conf. Eng. Transpar., Düsseldorf, Germany (2012)
Centelles, X., Martín, M., Solé, A., Castro, J.R., Cabeza, L.F. Tensile test on interlayer materials for laminated glass under diverse ageing conditions and strain rates Construction and Building Materials 243, 118230 (2020). doi: 10.1016/j.conbuildmat.2020.118230
Chen, X., Rosendahl, P.L., Chen, S., Schneider, J. On the delamination of polyvinyl butyral laminated glass: Identification of fracture properties from numerical modelling Construction and Building Materials 306, 124827 (2021). doi: 10.1016/j.conbuildmat.2021.124827
Chen, S., Chen, Z., Chen, X., Schneider, J. Evaluation of the delamination performance of polyvinyl-butyral laminated glass by through-cracked tensile tests Construction and Building Materials 341, 127914 (2022). doi: 10.1016/j.conbuildmat.2022.127914
DIN EN 12150. Glas im Bauwesen – Thermisch vorgespanntes Kalknatron-Einscheiben-Sicherheitsglas (2020)
DIN EN 1863. Glas im Bauwesen – Teilvorgespanntes Kalknatronglas. Beuth Verlag (2012)
DIN EN ISO 899-1. Kunststoffe – Bestimmung des Kriechverhaltens. Beuth Verlag GmbH, Berlin (2012)
Drass, M., Schneider, J., Kolling, S. Damage effects of adhesives in modern glass façades: a micro-mechanically motivated volumetric damage model for poro-hyperelastic materials International Journal of Mechanics and Materials in Design 14(4), 591–616 (2018). doi: 10.1007/s10999-017-9392-3
Drebenstedt, K., Euler, M. Statistical Analysis of Fatigue Test Data according to Eurocode 3. In: Powers, N., Frangopol, D.M., Al-Mahaidi, R., Caprani, C. (eds) Maintenance, Safety, Risk, Management and Life-Cycle Performance of Bridges: Proceedings of the Ninth International Conference on Bridge Maintenance, Safety and Management (IABMAS 2018), 9-13 July 2018, Melbourne, Australia. Bridge maintenance, safety and management, pp. 2244–2251. CRC Press, Boca Raton, FL (2018)
Ensslen, F. Zum Tragverhalten von Verbund-Sicherheitsglas unter Berücksichtigung der Alterung der Polyvinylbutyral-Folie. Dissertation, Ruhr-Universität Bochum (2005)
Franz, J. Untersuchungen zur Resttragfähigkeit von gebrochenen Verglasungen: Investigation of the residual load-bearing behaviour of fractured glazing, 1st edn. Springer Berlin Heidelberg; Imprint: Springer Vieweg, Berlin, Heidelberg (2015)
Jagota, A., Bennison, S.J., Smith, C.A. Analysis of a compressive shear test for adhesion between elastomeric polymers and rigid substrates International Journal of Fracture 104(2), 105–130 (2000). doi: 10.1023/A:1007617102311
Kothe, M. Alterungsverhalten von polymeren Zwischenschichtmaterialien im Bauwesen. Dissertation, Technische Universität Dresden (2013)
Kraus, M.A., Schuster, M., Botz, M., Schneider, J., Siebert, G. Thermorheologische Untersuchungen der Verbundglaszwischenschichten PVB und EVA ce/papers 2(1), 159–172 (2018). doi: 10.1002/cepa.639
Müller-Braun, S., Brokmann, C., Schneider, J., Kolling, S. Strength of the individual glasses of curved, annealed and laminated glass used in automotive windscreens Engineering Failure Analysis 123, 105281 (2021). doi: 10.1016/j.engfailanal.2021.105281
Pauli, A., Kraus, M.A., Siebert, G. Experimental and numerical investigations on glass fragments: shear-frame testing and calibration of Mohr–Coulomb plasticity model Glass Struct Eng (2021). doi: 10.1007/s40940-020-00143-5
Sackmann, V. Untersuchungen zur Dauerhaftigkeit des Schubverbunds in Verbundsicherheitsglas mit unterschiedlichen Folien aus Polyvinylbutyral, Technische Universität München (2008)
Schimmelpenningh, J. Laminated Glass: Creep of Unsupported Glass Pane. In: Glass Performance Days 2019. Glass Performance Days, Tempere, Finland, 26. - 28.06.2019 (2019)
Schuler, C. Einfluß des Materialverhaltens von Polyvinylbutyral auf das Tragverhalten von Verbundsicherheitsglas in Abhängigkeit von Temperatur und Belastung. Dissertation, Technische Universität München (2003)
Schuler, C., Bucak, Ö., Albrecht, G., Sackmann, V., Gräf, H. Time and Temperature Dependent Mechanical Behaviour and Durability of Laminated Safety Glass Structural Engineering International 14(2), 80–83 (2004). doi: 10.2749/101686604777964026
Schuster, M., Kraus, M., Schneider, J., Siebert, G. Investigations on the thermorheologically complex material behaviour of the laminated safety glass interlayer ethylene-vinyl-acetate Glass Struct Eng 3(2), 373–388 (2018). doi: 10.1007/s40940-018-0074-9
Schuster, M., Schneider, J., Nguyen, T. an. Investigations on the execution and evaluation of the Pummel test for polyvinyl butyral based interlayers Glass Struct Eng 5(3), 371–396 (2020). doi: 10.1007/s40940-020-00120-y
TROSIFOL. TROSIFOL Manual (2012)


