Article Information
- Digital Object Identifier (DOI): 10.47982/cgc.9.499
- Published by Challenging Glass, on behalf of the author(s), at Stichting OpenAccess.
- Published as part of the peer-reviewed Challenging Glass Conference Proceedings, Volume 9, June 2024, 10.47982/cgc.9
- Editors: Christian Louter, Freek Bos & Jan Belis
- This work is licensed under a Creative Commons Attribution 4.0 International (CC BY 4.0) license.
- Copyright © 2024 with the author(s)
Authors:
- Philipp Kießlich - TU Dresden
- Michael Engelmann - TU Dresden
- Bernhard Weller - TU Dresden

Abstract
Using glass elements as designated members of the structural design of buildings does not only require conscientious planning of structural redundancies, but also proof of safety for single components. In reality, random loads act in an unknown combination on a component, which is not directly resembled by the modelling process a priori. Hence, understanding the mechanical behaviour of glass components under probabilistic combination of static and dynamic loads is required. To serve this understanding best, the most critically loaded component of a glass shelter was examined experimentally by exposing extracted specimens to on-surface lateral loads and in-plane compressive loads simultaneously. Additionally, in-plane compressive loads were combined with soft-body impacts. This combination of static loads with short-term lateral loads is interesting in terms of stability and the residual load-bearing capacity. The results show how compressive in-plane loads increase stress and deformation according to first and second order deformations and indicate that premature stability failure occurs due to soft-body impacting.
1.Introduction
Every window and every glass in a façade experiences thermal, chemical and mechanical loads regardless of whether they are perceived as structural elements or not. In this regard, architectural applications of glass are always structural applications at the same time. The discrepancy in perception is due to the fact that intuitively glass is perceived as weak due to its transparent and brittle nature, although it has amazingly advantageous properties for structural applications. Deep knowledge of the material properties and component behaviour opens different design possibilities and expands the repertoire of applications.


Maximum transparency is a core element of architectural design (Henn 2023). Glass production technology developed during the last decade to allow freedom of form while maintaining transparency (e.g. see Figures 1 and 2). As a result, large expanses of glass and freely shaped façades are being realised more frequently. More complex loading situations, requiring a wider understanding of component behaviour. This includes the superposition of static loads and dynamic loads in terms of stability, short and long-term behaviour. In particular, accidental loads such as the impact of a person must not cause a dangerous situation. Accordingly, this paper presents the design of a specific glass component from ‘The greenLEAF Shelter’ that is subjected to different types of loads and its verification.
2.‘The greenLEAF Shelter’
2.1. Design
To evaluate the problem of combined loads on primary structural glass elements, a design study was done under realistic circumstances including other features relatable to sustainable design, which led to the design of ‘The greenLEAF Shelter’ in the project of same name at the Institute of Building Construction at Dresden University of Technology. The origin of the design concept is based on providing green areas in highly urbanised cities to address problems of low biodiversity and the heat island effect which can be achieved by repurposing the roofs of public transportation shelters. To ensure material sufficiency, the design does not use aluminium or steel supports and utilizes the glass panes for load transfer and bracing of the structure.
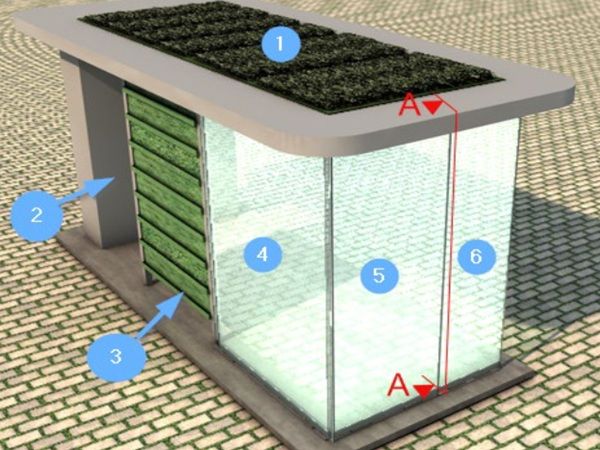
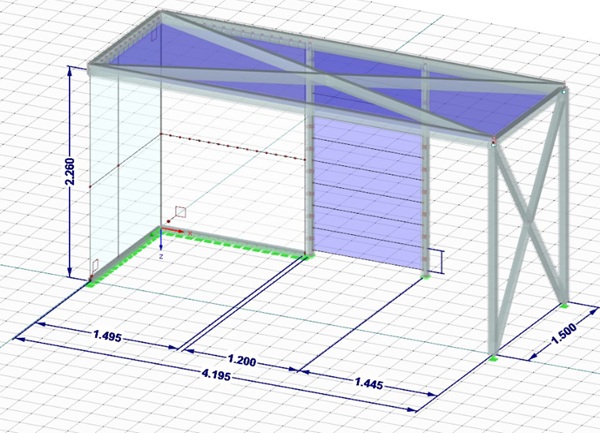
Throughout the structural design, the aim was to apply the latest regulations and design methods such as the requirements of (CEN/TS 19100-1-3) as a Draft Version from April 2021 (Feldmann et al. 2023). In addition (Haldimann et al. 2008) was used to compare design values and as a supplement. The basic structure of the shelter follows a modular design method, resulting in an available space of 4,20 m in width, 1,50 m in depth and an effective height of 2,26 m. Figure 3 shows the structurally critical variation of the shelter with its structural components. The roof (1 in Fig. 3) contains trays with biodegradable woven fleece to grow drought-tolerant crops. Both, fleece and crops, were specifically developed for this project but will be addressed in other publications.
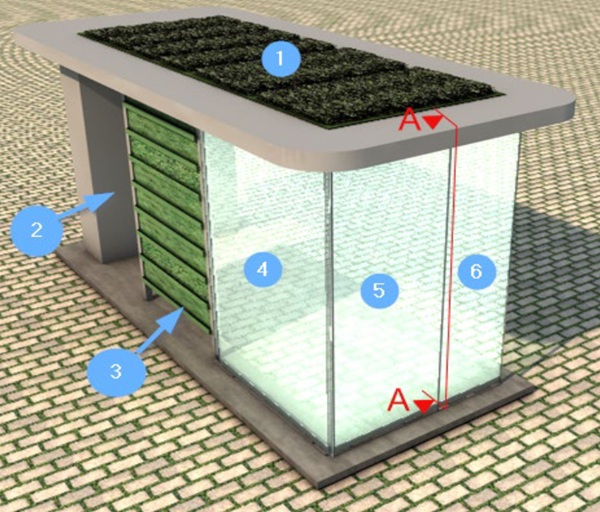
The shelter is designed to be easily dismantled and reassembled following a sustainable end-of-life design approach. The roof frame consists of hollow aluminium sections and is supported by a multimedia element (2) and three glass panels (4-6) with laminated glasses. The multimedia element also contains a water tank and the irrigation system. Vertical greening elements have been created using a frame and gabions (3).
2.2. Loads
The structural design of the shelter was carried out using a 3D FEA model in RFEM 5 by Dlubal (Figure 4). To calculate the geometric properties of the glass panes, loads and other requirements were derived according to (DIN EN 1991: 1-4) and DIN 18008 Parts 1,2 and 4 (DIN 18008-1,2,4) for the location “Suhl”, an exemplary medium sized town in Germany. For simplicity and safety, maximum values for loads were used, as detailed in Table 1. The dimensions of cross-sections must be considered conservative. The shelter has been classified as consequence class 2 (CC2) building.
Table 1: Design loads according to DIN EN 1991.
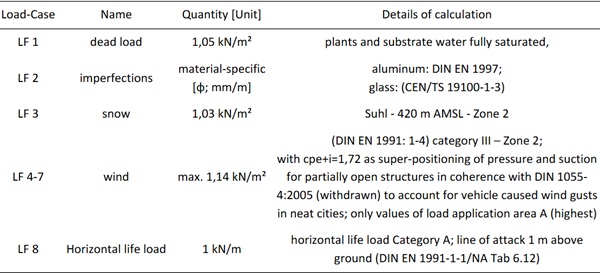
The decisive load combinations were determined. Critical load cases that vary for different components were super-positioned (“+”) in one load combination to calculate the maximum possible deformations and stresses for each component. Winter and summer cases were taken into account to determine the critical cases in terms of stress and deflection due to change of the laminated glass’ properties by temperature (see Table 3). Shear loads that would occur in the realistic application were taken into account in the numerical calculation but neglected during the experiments. The load combinations for the different possible limit states are the following:
Ultimate Limit State (ULS)
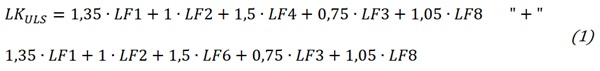
Serviceability Limit State (SLS)
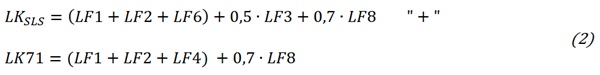
Fracture Limit State (FLS) and Post-Fracture Limit State (PFLS)
2.3. Construction details
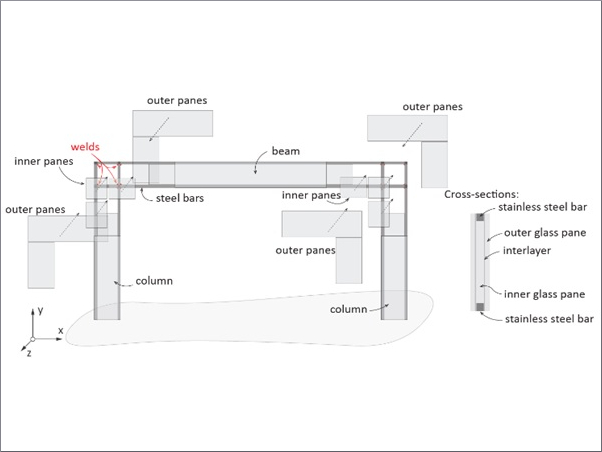
After calculating the load assumptions, the components’ preliminary dimensions were determined through verification. To account for structural redundancy all possible failure scenarios for each of the laminated glasses and their single panes were identified and calculated iteratively. The first important step was to determine which glass component (see Figure 3, Numbers 4 to 6) would leave the system statically indeterminate in case of failure and then split it into two components. Secondly, the cross-sections were adjusted to fulfil the verifications. To ensure structural stability in all failure cases up to a failure of 50% (surface area) of the panes in the worst case or 70% in the structurally favourable case. Specifically, it resulted in the segmentation of the previously 1.50 m wide front plate into two components of 900 mm and 600 mm (see Figure 4 Number 5 and 6) to prevent crack propagation in the event of failure. The smallest pane (6) was then defined as the critical component due to its minimal cross-section in comparison to the applied loads.
The detail of the glass components and their connection to the roof are illustrated by Figure 5 and Figure 6.
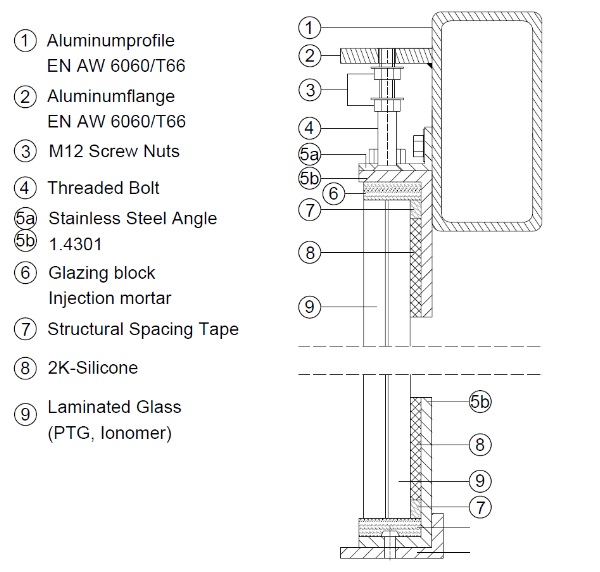
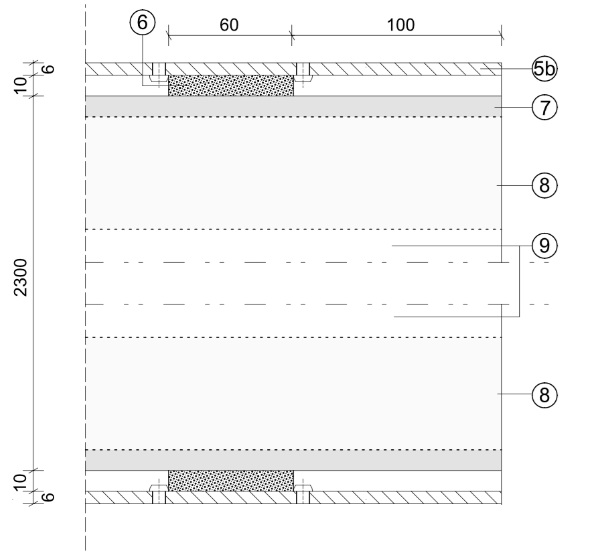
Figure 5. shows how any of the glass packages is adhesively bonded to a stainless-steel L-Section (5a). A structural spacing tape (7) of 6 mm thickness separates the injection mortar (6) from the adhesive (9) to prevent chemical incompatibility. The adhesively joined element is screwed to the hollow profile by an additional stainless-steel profile (5b). A threated bolt (4) and two screw nuts (3) allow tolerance adjustment in height during assembly. Details can be taken from Table 2.
Table 2: Components dimensions.
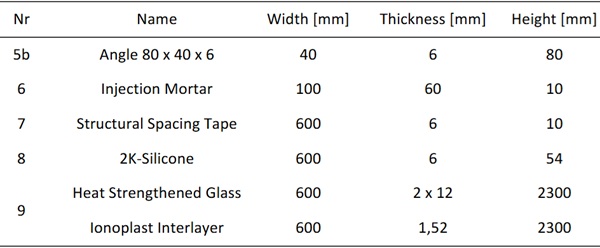
This design enables quick and simple re-glazing and full pre-assembly in the factory. The glass package is loaded centrally at the middle of the top edge, right beneath the threaded bolt (4) due to design. The use of pressure-resistant injection mortar ensures an ideal load application without generating stress peaks as it compensates for production tolerances of the laminated glass. The mortar shrinkage creates a sliding bearing, which results in existing shear loads being dissipated by the adhesive joint. Additionally, it reduces stress caused by lateral loads on the glass pane.
The design principle is similar to the Willy-Brandt Subway Station in Frankfurt a.M. (Wellershoff et al. 2011) with the deliberate difference that no clamping of the pane was chosen, but rather a deformation behaviour based on SSG-façade construction. This construction resembles a support situation that is an intermediate variation of a hinged supported, which is the base to the assumed Euler Case 2 (see chapter 3), and a clamping, which is resembled by Euler Case 4. This is addressed in Chapter 6.
3. Buckling Verification and Design Values
For the purpose of verification, calculation values for modelling in RFEM and analytical verification had to be determined. This includes material properties, which are summarised in Table 3, and assumptions regarding calculation, which are specified in Table 4.
Table 3: Material properties used for calculations.
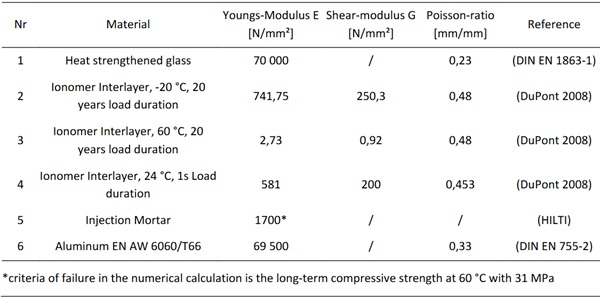
Table 4: Assumptions on criteria for calculation of glass panes.
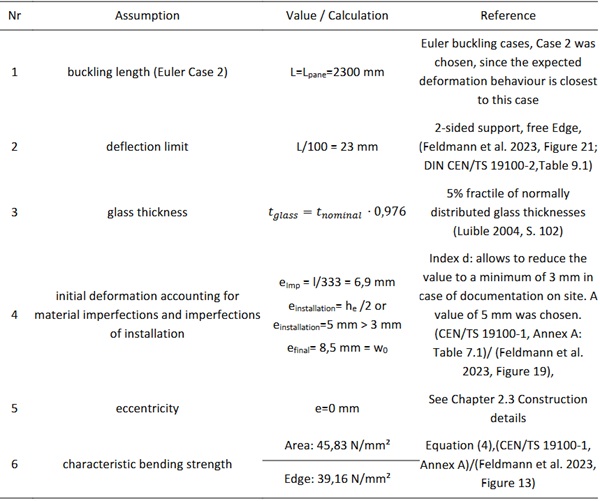
Design strength for in-plane loaded heat strengthened glass with a polished edge and an area smaller than 18 m² were determined using Equation (4) with the results shown in Table 4. Due to CC2 of the shelter, the material safety coefficient γm is 1,8.

With the given assumptions analytical buckling verification was performed according to (CEN/TS 19100-3, Annex A), which corresponds to first buckling mode according to Euler-Bernoulli beam theory. As there is no verification method available for the combination of compression loads and lateral loads, buckling for pure compression was first checked using Equation (5). The calculation of bending stress according to second order (see Equation (6)) describes that also deflections and stresses caused by lateral loads have influence on buckling (Luible und Crisinel 2004) and therefore must be accounted for in the verification process.
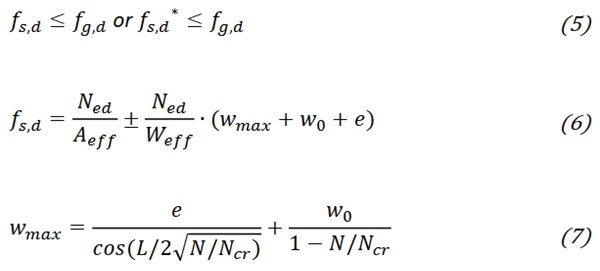
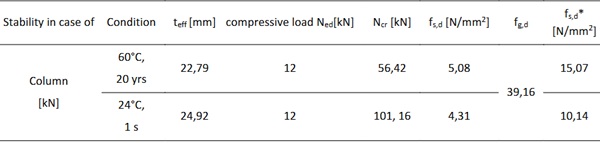
The calculation was conducted for interlayer properties at 60°C and 20 years load duration as well as at 24°C with 1-second load duration to represent both the critical load cases for construction and the experiments. The combination of wind pressure on the rooftop, snow and dead load introduce pressure to the top edge of the panes that result in a compression of the glass pane and is therefore noted as in-plane compressive load. Equation (8) is provided in Annex A of (CEN/TS 19100-3) and uses an effective moment of inertia (9). For comparison, the critical load was also calculated according to elastic sandwich theory with an effective thickness according to equation (10) (Luible 2004, S. 103). Both methods yield the same critical buckling load for the given construction and support conditions in this simple case.
Where:
Iz,eff - effective moment of inertia
L - critical buckling length
The results for the given equations are summed up in Table 5 and the proof of stress and resistance was successful. However, because lateral loads have to be taken in consideration as well, the verification is incomplete and experimental verification will be conducted. As first additional step maximum deflections (5,89 and 1,65 mm) and maximum principal stress (7,01 and 5,15 N/mm2) for load case ULS and the given construction parameters were calculated in MEPLA considering second order theory. These values were added in equation (6) and (7) calculating a higher stress fs,d* that was used for proof instead of fs,d in equation (5). Both proofs are still checked, but the characteristic stresses increased by factors of approximately 3 and 2, respectively.
Table 5: Critical buckling loads in case of pure compression.
4. Experimental Investigation
Verifying the prescribed component is not a standardised process. Therefore, a testing stand was constructed and an experimental programme was designed to emulate the load situation as expected in reality as closely as possible.

The experimental program focuses on verifying the various state limits, as shown in Figure 7 and includes the specific points:
- ULS – the load combination that was used to verify the load capacity of the component is a combination of 12 kN compressive load from snow, wind and deadload of the rooftop, 0,87 kN/m2wind load and a horizontal life load of 1 kN/m that acts at 1 m above ground. This combination of loads is further noted as LC1, LC2 and LC3 refer to this load combination with factors of 1, 2 and 3.
- SLS – the maximum allowed deflection was checked simultaneously when ULS-LC1 was carried out.
- Stability under compression and impact - double-tire soft-body impacts (DIN 18008-4:2013, Category A) combined with compression loads up to 100 kN were conducted. The construction has to withstand an impact from 900 mm to be verified. Besides, falling height falling heights of 200 mm, 450 mm and 700 mm were investigated to gradually understand component behaviour
- PFLS – Structural stability in case of one broken pane was verified by applying LC1 load to the component with the outer pane broken. In addition, compression load was increased until failure. Residual load bearing capacity over 24 hours with LC2.
Chapter 2.3, Table 2 describes the construction and the dimensions of the investigated specimens. In total 6 specimens were tested at 21°C room temperature. Shear loads that would occur in the realistic application were neglected during the test. The specimens were tested in horizontal position. Lateral Loads are not decreased by dead loads.
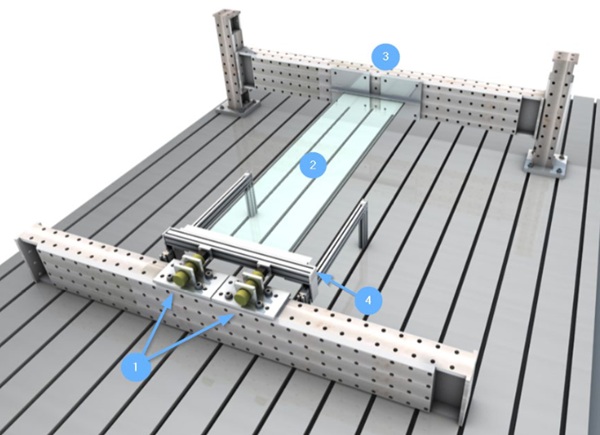
The testing stand utilises hand-driven hydraulic presses (1 in Figure 8) (Enerpac, max. load 250 kN) to simulate the in-plane compressive loads on the pane (2). On-surface lateral loads were simulated by an equivalent amount of stacked steel weights. LC1 is defined by 12 kN of compression, 60 kg at a height of 1 m from bottom (3), and 120 kg evenly distributed over the surface area of 1,38 m2 for windload. To prevent damage to the joints during weight-stacking the pane was held by the crane until the start of the experiments. A slide bearing enables the traverse (4) to move freely in direction of loadintroduction to simulate the vertical transition of the rooftop in reality.
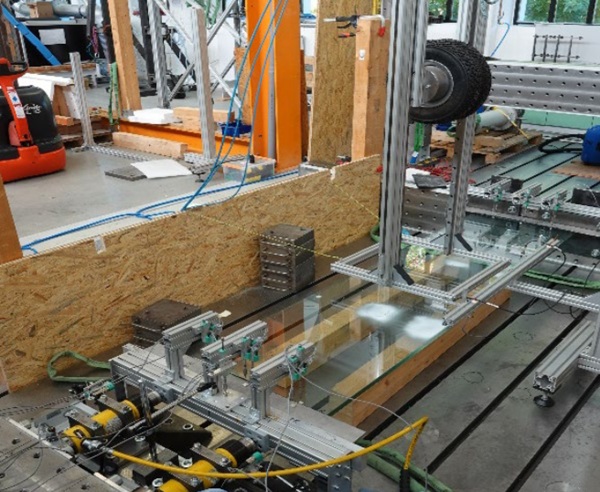
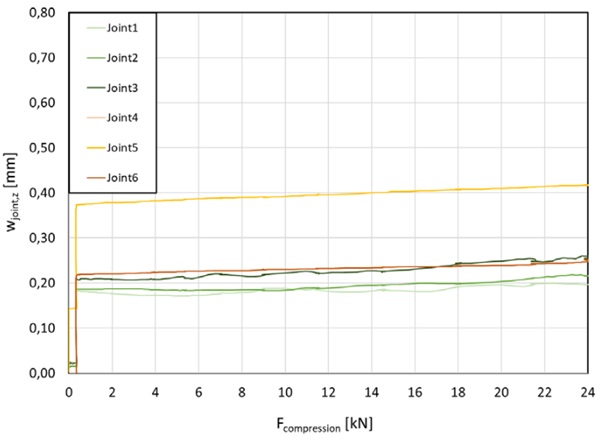
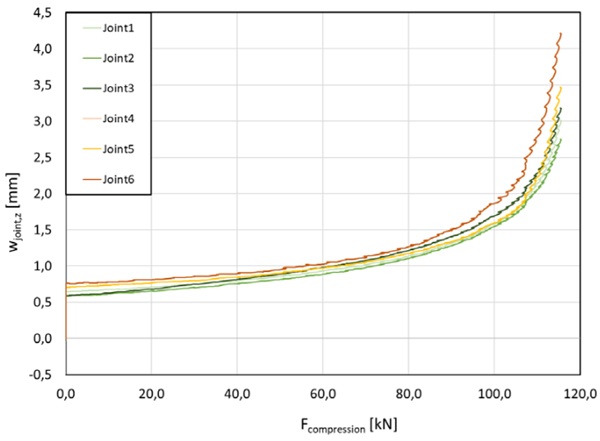
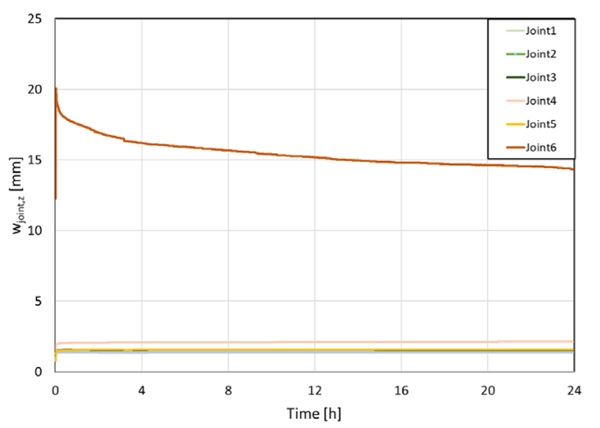
Deflections were measured using displacement transducers. Deformations of the glass pane and steel angles at top and bottom ends were measured by inductive transducers (Gefran) (see Figure 10 Pos.1 to 12). In relation to the milled clamping field, the joint deflections were calculated by pairing data of Points 1 and 4, 2 and 5 et cetera. The pairs are named ‘Joint 1’ to ‘Joint 6’ in ascending order of the pairs. Displacement at the edge and middle were measured using laser displacement sensors (Micro-Epsilon/ILD1320-100). The laser sensors were used alone in case of soft-body impacting, since inductive transducers were not reliant due to their mass inertia. The z-a xis points downwards in the direction of gravity during the test. Any positive deflection is considered bending towards the clamping field.
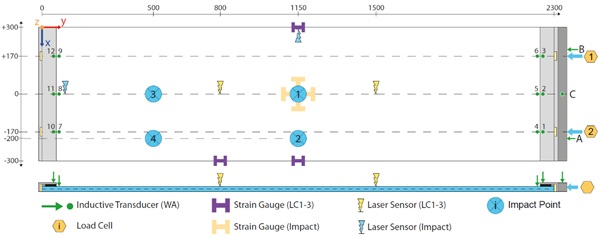
Inductive inducers A and B measure the translation along the y-axis which is nearly equal to the shortening of the pane’s chord during bending. Transducer C was used to record whether the component avoided load introduction in the z-a xis. Two load cells (Gefran/TM-kN1C) with a maximum range of 100 kN logged the introduced load. The resulting stress was measured in discrete places with uniaxial strain gauges (Tokyo Measuring Instruments Lab/FLAB-6 -350-11). The positions of the gauges and the laser were alternated between LC- load cases and soft-body impacting as shown in Figure 10.
5. Results
5.1. ULS and SLS
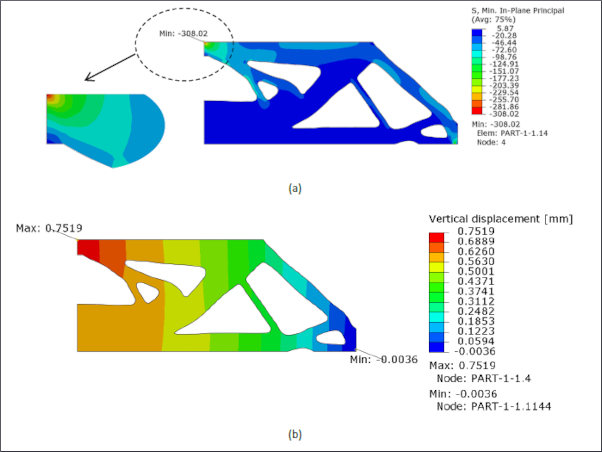
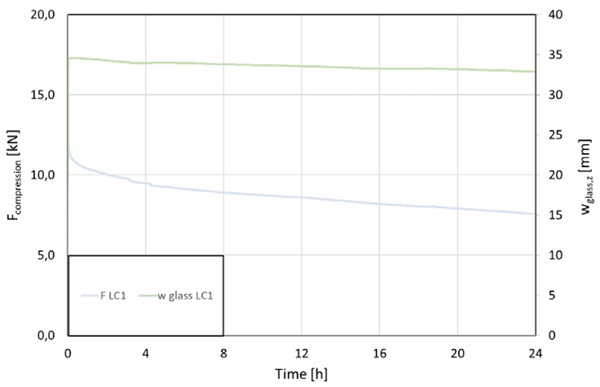
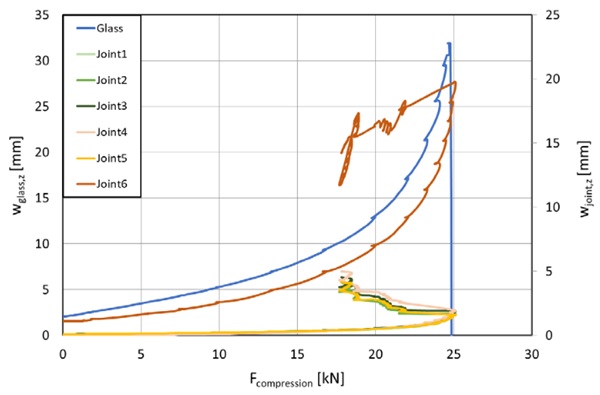
Figure 11 illustrates the results of the first point on the experimental program, which involved introducing LC1, LC2 and LC3 to verify ULS and SLS. Grey lines have been added to the graph to indicate characteristic levels for in-plane compressive loads and the maximum allowed deflection. LC3 was tested until the specimen 1 failed completely at 111 kN, with cracks appearing and multiplying slightly above 100 kN, as indicated by ripples in the graphs w LC3 800 and 1500 (800 and 1500 refer to the measurement in Y-Axis, see Figure 10). Similar ripples in the graphs for stress and loads are related to pressure drops in the hydraulic system due to the opposing force on the cylinders. Notably, effects of II. order start to become apparent at approximately 47 kN and 19 mm of deflection, as evidenced by load and stress diverging drastically. The deflection limit of 23 mm was only reached after triple the load and additional increase of compressive load until 80 kN.
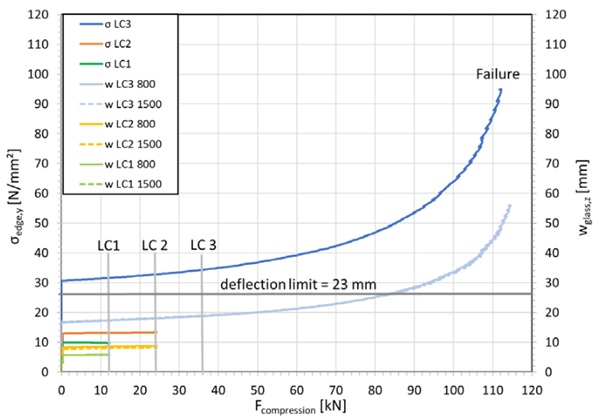
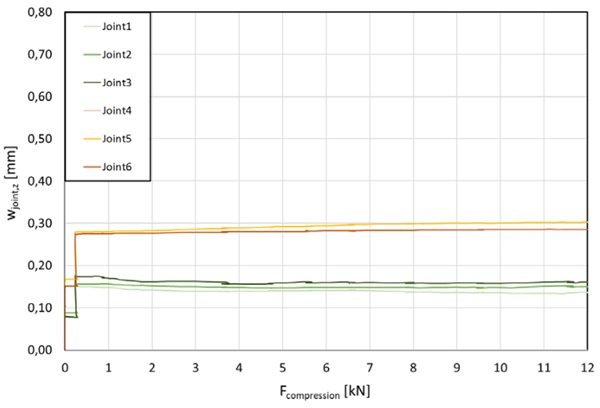
Figure 13 and Figure 14 display the deformations of the joints. There is a slight tendency for the joint at the top (Joint 4 to 6) to be deformed more strongly. The failure occurred at the glazing blocks, where parts of the glass detached from the surface due to very fine crack systems. Tensional stress concentrations near the glazing blocks are commonly the reason of failure for glass panes under pure and high compression (Ebert 2014). A preferred mode of failure for combined loads is unknown to the author. By theory it is dependent on geometrical and material properties as well as the quantity of applied forces and their interaction. The behaviour at the load introduction is not addressed in this research.
5.2. Soft-body impact
Without compression
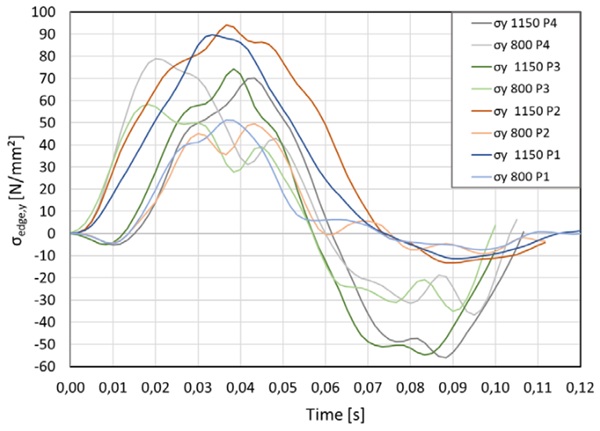
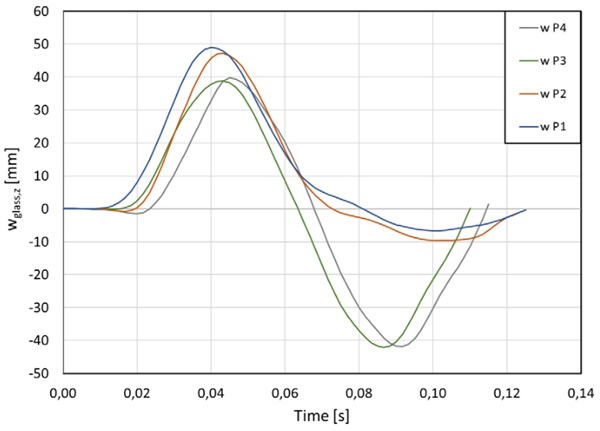
To decide which impact point is critical for the given component, reference curves were recorded by impacting specimen 2 at every pendulum point with a falling height of 900 mm before testing the stability under compression. For these tests only, the positions of the strain gauges were analogue to testing ULS and SLS (see Figure 10, Strain Gauges LC1-3), mainly because of practicability and characteristic bending strength being lower at the edge than in the middle of surface. Deflections were taken as Figure 10 displays.
The results of the stress component in the Y-Axis are presented in Figure 11, and the related deformations are shown in Figure 12. No failures occured. Observed bending stresses at 1150 mm are highest for Impact Points P1 (89,69 N/mm2) and P2 (94,01 N/mm2). Maximum Deflections at the same height are 48,93 mm for P1 and 47,16 mm for P2. As both are similar in results P1 was chosen as the decisive pendulum point because measured stresses at 800 mm are slightly higher too.
With compression
All falling heights were tested under compression. The results for 700 mm and 900 mm are presented below. Figure 17 and Figure 18 display the resulting stresses and deflections for a falling height of 700 mm and additional in-plane compressive loads of 2 kN, 22 kN, and 75 kN. Stability was verified and no failures occurred in these cases. As the load increased, higher stresses and deformations were observed, consistent with expectations (refers to equation (6)).
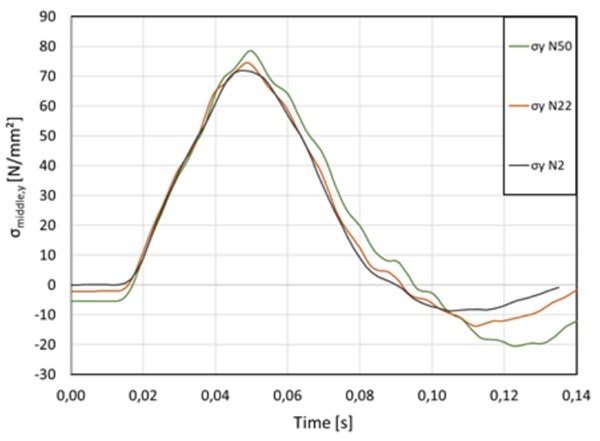
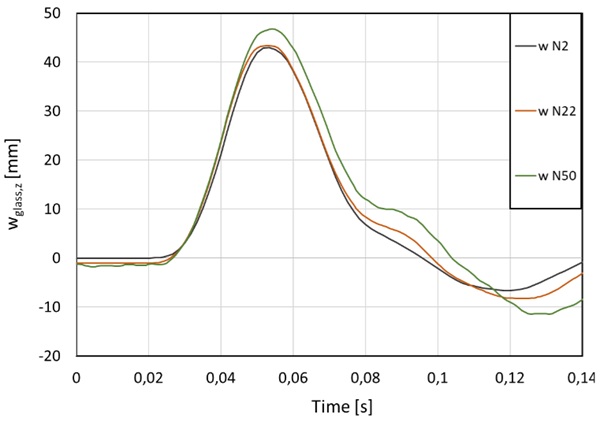
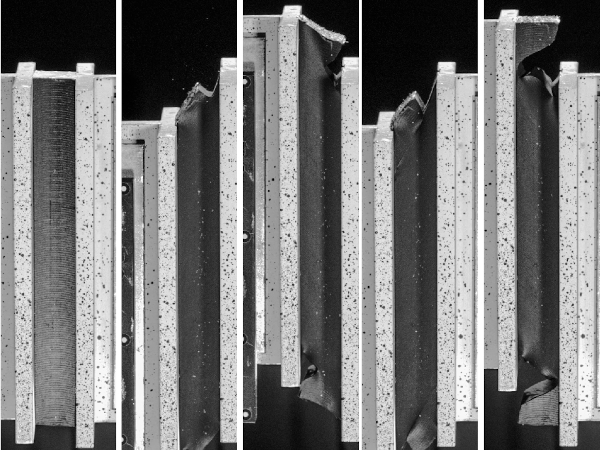
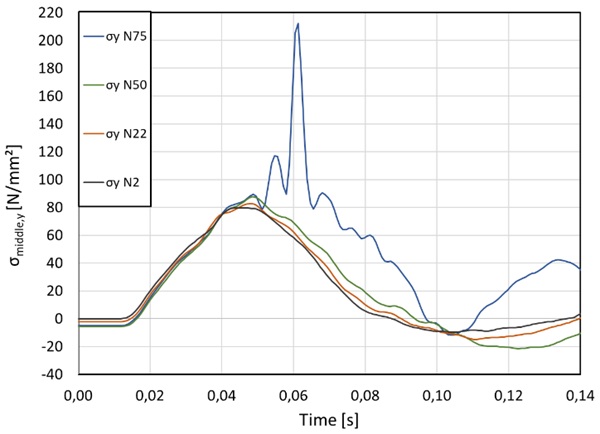
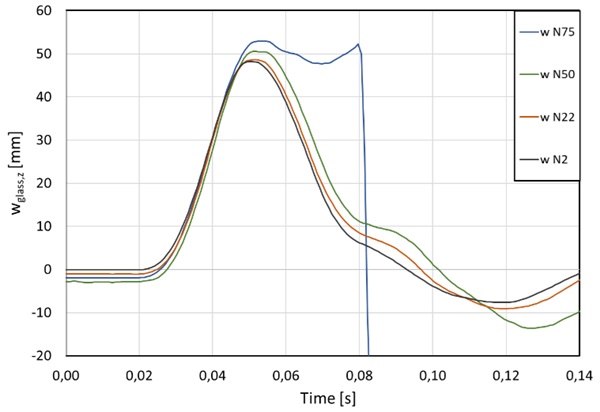
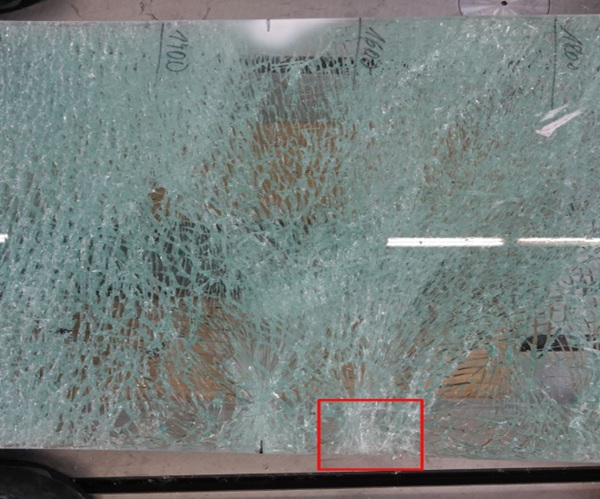
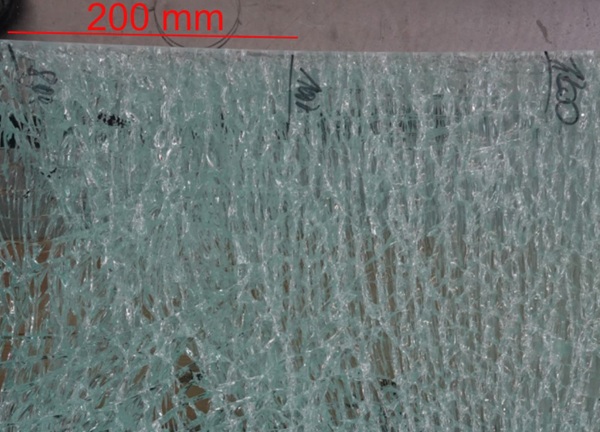
Figure 19 and Figure 20 show stress and deflection for a falling height of 900 mm and compressive load of 2 kN, 22 kN, 50 kN and 75 kN. There is a clear tendency for increasing deflections and stress with increasing compressive load. A compressive load of 75 kN resulted in failure during impact around Timestep 0,05 s. Failure becomes visible as stress and deflections start to increase after impacting instead of declining. Deflections are only observable until 0,08 s, after that they grew bigger than the measurable length. The delay in time (0,05 s to 0,08 s) between failure of the pane and observable data, results in the hypothesis that the pane broke while swinging back up and cracks origined from the edge which is supported by the fracture pattern highlighted in Figure 21. The density of cracks and therefore small shards are finer (see Figure 22) than usual for heat-strengthened glass but as expected for components under compression (Luible 2004). According to Table 5 the analytical critical buckling load is 101 kN in pure compression. However, in this case, stability failure by buckling was reached at 75 kN due to impact. Since all four impacts under compression were conducted on the same specimen it is still possible that failure occurred due to sub-critical crack growth or fatigue, altough these phenomenas are less critical for thermally treated glass (Hilcken 2015).
5.3. PFLS - Residual load-bearing capacity
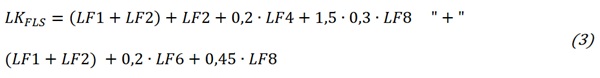
Finally, to verify the safety of the component in the fractured and post-fractured limit state, a specimen with the outer broken pane was supposed to be subjected to LC1 loads for 24 hours. Despite double the defined steel weights being applied accidentally in this test, (like for LC2) the construction did not fail. The initial pressure of 12 kN declined to 7,5 kN during the test because of uncontrollable pressure loss in the hydraulic system. For PSFL reduced loads of 4,54 kN compression load (maximum value over all cases of redundancy), 0,27 N/mm² equal to 27 kg life load and 0,228 N/mm² wind load equal to 22,8 kg according to Equation (3) were necessary to verify the component. As 7,5 kN in compression, 240 kg for wind and 120 kg life load were endured for 24 hours, the component is regarded as structural stable in case of one broken pane.
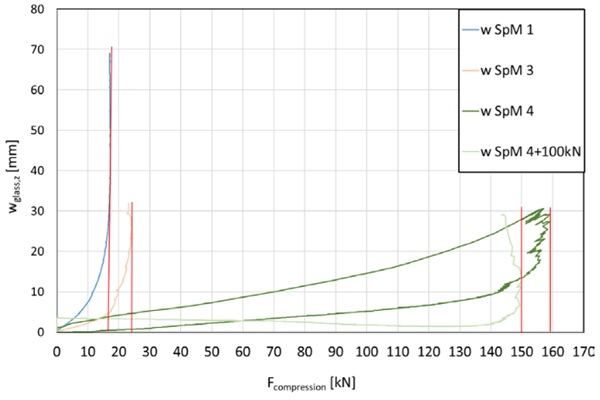
To validate the fracture limit state, specimen 2 with an outer broken pane was subjected to LC1, and further compression was applied until total failure at 24,8 kN (refer Figure 25). The displayed deflections exclude initial deformations. This demonstrates that the component can withstand higher loads than the necessary 4,54 kN.
As shown, the residual load bearing capacity (see Figure 26) was unexpectedly low for specimen 1, with 17 kN, and specimen 3, with approximately 23 kN. Specimen 4 was the only one to buckle in the opposite direction, compressing the adhesive joint and bending towards the steel angle. For better readability, the lateral deflection of “w SpM 4” is denoted with positive values in Figure 26. It withstood a maximum load of 159 kN without breaking, which is significantly higher than the predicted critical buckling load. It was finally brought to fracture by loading 100 kg in the middle of the pane by producing an unfavourable initial deformation and yet it still needed 150 kN of load to destroy it.
In this case the residual bearing capacity in the fractured state was higher than the analytical critical buckling load in the unbroken state. Even when considering the difference of the analytical method and experiment, this shows how sensitive a construction might be to ideal or unfavourable conditions such as imperfections or asymmetrical load introduction which can cause significant deviations in mechanical performance. It emphasises the importance of clean execution when adhesively bonding and installing such constructions, regardless of whether it is analytically or experimentally designed.
6. Conclusion and Outlook
The presented paper contributes by providing experimental verification for the design of a structural glass component that is subjected to a combination of compression, on-surface lateral loads and a soft-body impact. Additionally, an approach for analytical verification with recent guidelines was executed. The results show that in-plane compressive loads have an influence on the deformation and stresses during a soft-body impact, which can endanger the construction and lead to premature stability failure when left unconsidered during calculation. In consequence, an analytical method to estimate critical buckling loads under compression and lateral loads is needed.
It seems reasonable as a first approach to calculate a critical buckling load derived from second order differential equations for monolithic glass by using effective thicknesses for laminated glass and increase the initial deformations by the value of deformations that is caused by lateral loads as well as the stresses analogue to the proposed calculation in chapter 3. Yet, to be methodically consistent it is advised not to mix results from analytical and numerical calculations to achieve this.
To account for sub-critical crack growth, the kmod factor for float glass varies with load duration. It is unclear which factor has to be used for the combination of wind loads (3s duration, kmod = 1,00) and dead loads (permanent, kmod = 0,29) when calculating characteristic bending stresses. Until now, a conservative approach would recommended not to use annealed glass in case of such complex load situations or using kmod=0,29.
Further investigations should focus on improving aspects of the experiments. To ensure statistical significance, the number of specimens and impact processes for each magnitude of compression should be increased. It is recommended to choose compression levels that correspond to percentages of analytical buckling loads with respect to the specimens' slenderness. The concept of slenderness ratio is a valid design approach considering lateral torsion buckling and buckling of plates (Haldimann et al. 2008, Chapter 5). Within these slenderness concepts the resistance to stability failure is dependent on critical buckling moment and load in respect to the resistance influenced by support conditions and geometrical properties.
Compared to an equally loaded glass pane without adhesive bonding, it is expected that adhesive bonding reduces deformation on the planes in case of impact and lateral load as it 1) dissipates energy during impact and 2) creates a rotational constraint that is not covered assuming a hinged support condition in a clamped structure. Constraining rotations of the glass with adhesive joints may decrease the critical buckling length, acting as a support of intermediate stiffness compared to clamping and free rotation. Whether or not this is a relevant case is open to experimental investigation.
Finally, creating and validating a FEA model for soft-body impacting with the help of the experiments will be aimed for next. With such model parameter studies can be performed that contribute to solving questions of premature stability failure and its conjuncture to the component’s slenderness.
Conflict of interest.
On behalf of all authors, the corresponding author states that there is no conflict of interest.
Acknowledgements
The author likes to thank the Federal Ministry for Economic Affairs and Climate Action (BMWK) and the “Central Innovation Programme for small and medium-sized enterprises (SMEs)” for the funding of the research project “greenLEAF”.
References
DIN EN 755-2: Aluminium and aluminium alloys - Extruded rod/bar, tube and profiles. Part 2: Mechanical properties. DIN Deutsches Institut für Normung e.V. (2016).
CEN/TS 19100-1: Design of glass structures. Basis of design and materials. Comité Européen de Normalisation (04/2021).
CEN/TS 19100-3: Design of glass structures. design of in-plane loaded glass components and their mechanical joints. Comité Européen de Normalisation (04/2021).
DIN CEN/TS 19100-2: Design of glass structures. Desing of out-of-plane loaded components. Comité Européen de Normalisation (04/2021).
DuPont (2008): SentryGlas®Plus Elastic Properties. Available online: https://www.mepla.net/media/medien/sentryglasr_plus_elastic_properties_2008_51654.pdf, Checked last: 11.03.2024.
Ebert, Jan: The application of heavy loads into glass edges - A contribution to the use of solid plastics as a block material. Einleitung hoher Lasten in Glaskanten. Dresden, Technische Universität Dresden, Diss., 2014. Saechsische Landesbibliothek- Staats- und Universitaetsbibliothek Dresden; Technische Universität Dresden, Dresden (2014). URL: https://nbn-resolving.org/urn:nbn:de:bsz:14-qucosa-150650.
DIN EN 1991: 1-4: Eurocode 1 - Actions on structures - Part 1 to 4. DIN Deutsches Institut für Normung e.V. (04/2010).
Feldmann, M.; Laurs, M.; Belis, J.; Buljan, N.; Criaud., A.; Dupont, E. et al.: The new CEN/TS 19100: Design of glass structures. In: Glass Struct Eng 8 (3), S. 317–337 (2023). DOI: 10.1007/s40940-023-00219-y.
DIN 18008-1,2,4: Glass in building - Design and construction rules. Part 1: Terms and general bases, Part 2: Linearly supported glazings, Part 4: Additional requirements for barrier glazing. DIN Deutsches Institut für Normung e.V. (2010).
Haldimann; M.; Luible, A.; Overend, M.: Structural Use of Glass: IABSE. Zürich (2008). ISBN 978-3- 85748-119-2.
Henn, Gunter (2023): Formen der Transparenz. In: Bernhard Weller und Silke Tasche (Hg.): Glasbau 2023: Wiley, S. 1–5.
Hilcken, Jonas: Zyklische Ermüdung von thermisch entspanntem und thermisch vorgespanntem Kalk-Natron-Silikatglas. Dissertation. Springer-Verlag GmbH (2015).
HILTI: Hilti HIT-HY 270 Mörtel im konstruktiven Glasbau. Hg. v. HILTI. Available online: https://docplayer.org/31456795-Hilti-hit-hy-270-moertel-im-konstruktiven-glasbau-befestigungen-mit-durchblick-hilti-mehr-leistung-mehr-zuverlaessigkeit.html. Checked last: 30.04.2024
Luible, Andreas: Stabilität von Tragelementen aus Glas. Dissertation. Ecole Polytechnique Federale de Lausanne, Lausanne (2004).
Luible, Andreas; Crisinel, Michel: Buckling Strength of Glass Elements in Compression. In: Structural Engineering International 14 (2), S. 120–125 (2004). DOI: 10.2749/101686604777964107.
DIN EN 1863-1: Teilvorgespanntes Kalknatronglas. Definition und Bedeutung. DIN Deutsches Institut für Normung e.V. (2012).
Wellershoff, Frank; Sendelbach, Michael; Schmitt, Felix: Einsatz von tragenden Glaselementen in Glasbrücken und Glaspavillions. In: Stahlbau 80 (S1), S. 13–23 (2011). DOI: 10.1002/stab.201120003.