Article Information
- Digital Object Identifier (DOI): 10.47982/cgc.9.620
- Published by Challenging Glass, on behalf of the author(s), at Stichting OpenAccess.
- Published as part of the peer-reviewed Challenging Glass Conference Proceedings, Volume 9, June 2024, 10.47982/cgc.9
- Editors: Christian Louter, Freek Bos & Jan Belis
- This work is licensed under a Creative Commons Attribution 4.0 International (CC BY 4.0) license.
- Copyright © 2024 with the author(s)
Authors:
- Joseph Robert Yost - Villanova University
- Jorge Huisa Chacon - Villanova University
- Yoa Lu - University of Pennsylvania
- Masoud Akbarzadeh - University of Pennsylvania
- Damon Bolhassani - City College of New York
- Fahimeh Yavartanoo - City College of New York
- Phillipp Amir Chhadeh - Technische Universität Darmstadt
- Jens Schneider - Technische Universität Wien

Abstract
This research is related to the structural performance of a shell-type system made of hollow glass units (HGU) that utilizes glass as the primary structural material. The efficient structural function of the proposed shell-type system is designed using Polyhedral Graphic Statics to achieve a system geometry that maximizes in-plane compression and limits the presence of tension. The large-scale shell structure is constructed using a modular assembly of individual hollow glass units. To date, the research team has completed studies on individual HGU strength and stiffness, and the performance of the interface material necessary to transmit the high in-plane compression forces between neighboring HGUs. As well, the feasibility of the proposed modular system has also been demonstrated through the successful assembly and disassembly of a 3 m span prototype pedestrian bridge known as Tortuca. Tortuca is comprised of 13 individual interlocking HGUs assembled into a compression-dominant form supported on steel abutments. In the current research study, the physical performance of Tortuca is experimentally investigated under controlled laboratory testing and using an extensive assortment of displacement and strain sensors. Significant findings related to experimental testing of Tortuca will be reported.
1.Introduction
Glass is a material having strength and stiffness properties that are structurally favourable in compression, and dangerously brittle and unpredictable in tension. It is also a material that is transparent, and consequently, very desirable in building and architectural applications. Thus, using glass as a primary structural building material, mandates exploiting its compression strength and, simultaneously, eliminating, or severely limiting the presence of tension. With this objective, the use of an analytical method known as Three Dimensional Polyhedral Graphic Statics (3DGS) is an efficient way of designing spatial structures having geometric form that maximizes in-plane compression of flat sheet materials. This method of analysis relates structural form to force equilibrium using polyhedral geometric relationships. Details related to 3DGS can be found in Akbarzahdeh (2015) and Akbarzadeh et al. (2016), and its use in structural design is described in Bolhassani et al. (2018).
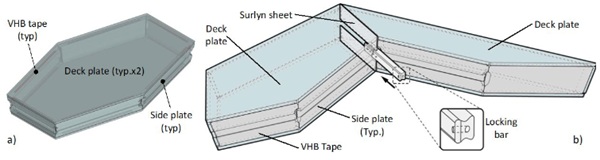
It is the goal of this research to use glass as the primary structural material in construction of compression dominant shell structures designed using 3DGS and built using modular assembly technology. In the proposed modular system, the elemental building unit is referred to as a hollow glass unit (HGU) and it is composed of two glass deck plates, and acrylic side plates, as shown in Fig. 1a. The glass deck and acrylic side plates are joined into a rigid three-dimensional hollow structural unit using a transparent double sided structural tape known as VHB and manufactured by 3MCorporation (3M 2021). Strength and behaviour of individual HGUs under in-plane compression has been studied by Yost et al. (2022a). In the proposed modular system, the individual HGUs are interconnected using a locking bar as shown in Fig. 1b. Strength of the system is derived from in-plane compression in the deck plates. Consequently, to avoid glass-on-glass contact between neighbouringHGUs at the connection joint, a transparent thermoplastic known as Surlyn is used as an interface material (Surlyn 2024, Yost et al. 2022b).
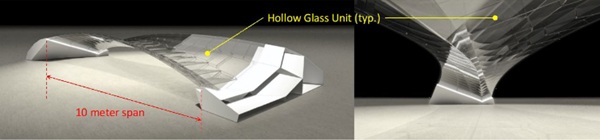
The ultimate objective related to this modular construction technology is construction of an all-glass 10 m span pedestrian bridge, as is shown in Fig. 2 (Akbarzahdeh, et al. 2019). Note the curvature of the bridge when viewed in elevation. This is a consequence of the 3DGS design methodology and the corresponding structural function of the bridge as a compression-dominant system. As is noted, the bridge is composed of a series of interlocking three-dimensional hollow glass units (HGU).
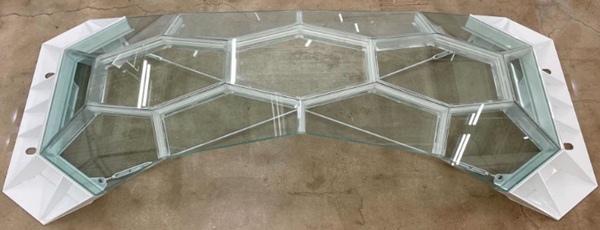
To demonstrate the feasibility of the proposed modular glass system, a 3.3 m span prototype bridge was built, which is known as Tortuca, and means turtle or tortoise in Latin. A picture of Tortuca is shown in Fig. 3. In the current publication, the physical behavior of Tortuca is experimentally evaluated under load testing in the laboratory. Full details related to individual HGU fabrication, and construction of Tortuca can be found in Lu et al. (2022).
2. Bridge Details
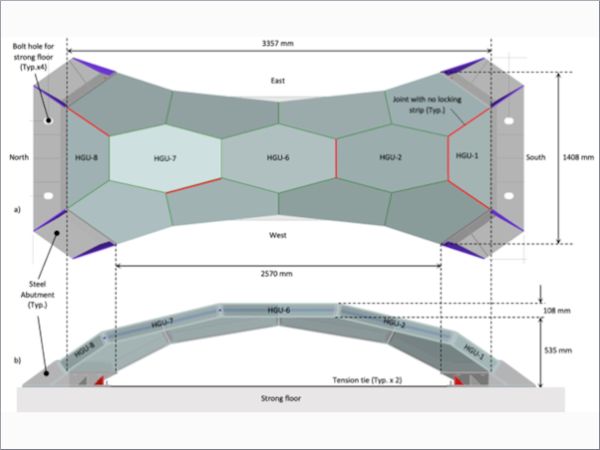
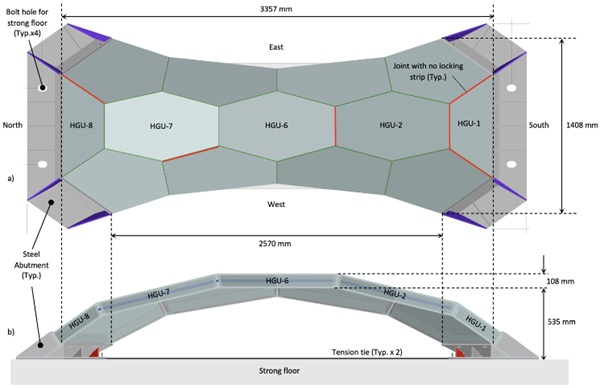
The glass bridge known as Tortuca is shown in plan and elevation view in Fig. 4, where it is noted the NS axis is the span length axis of the bridge, and the EW axis is perpendicular to this, or the width axis. The bridge was supported by steel abutments that were bolted to the strong floor, and two tension ties oriented in an ‘X’ shape connected the N- and S-abutments (also see Fig. 3). The bridge was composed of 13 individual hollow glass units (HGU), with units 1, 2, 6, 7, and 8 on the bridge NS centreline. Each HGU consisted of 10 mm thick top and bottom deck plates made of float glass, and acrylic side plates. Connection between deck and side plates was made using a transparent double sided structural tape known as VHB (3M 2021). The joint connection detail is as shown in Fig. 1b and consists of acrylic locking bars and Surlyn thermoplastic as the transparent interface material. To make possible the modular assembly of the bridge the connection detail of Fig. 1b was absent from the sixjoints identified in Fig. 4a.
3. Experimental Program
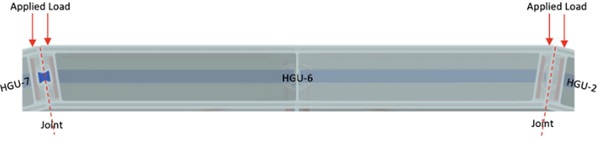
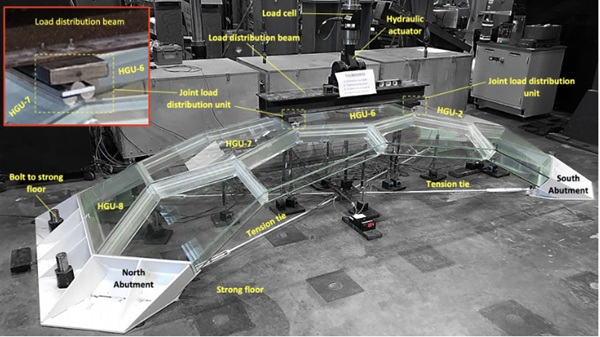
The glass bridge Tortuca was tested under a symmetrical load case with load applied hydraulically to the N- and S-sides of the joints between HGUs 2-and-6, and HGUs 6-and-7, as is shown in Fig. 5 and Fig. 6. An MTS servo controlled hydraulic actuator with 165 kN capacity was used to apply force and operated in displacement control.
Force from the hydraulic actuator was distributed to each joint using a load distribution beam, as shown in Fig. 6. Note that load was applied along the entire EW dimension of each joint, and that the joint between HGU-2 and HGU-6 did not have a locking bar connection but the joint between HGU-6 and HGU-7 did. A joint load distribution unit was used at each joint to equally distribute the hydraulic force on each the N- and S-sides of each joint (see Fig. 6). A maximum total load of 7.1 kN was applied, which corresponds to all centreline top deck plates loaded with 4.0 kN/m2 of pedestrian live load (AASHTO 2009), and thus this force magnitude represents behaviour of the bridge at the service limit state.
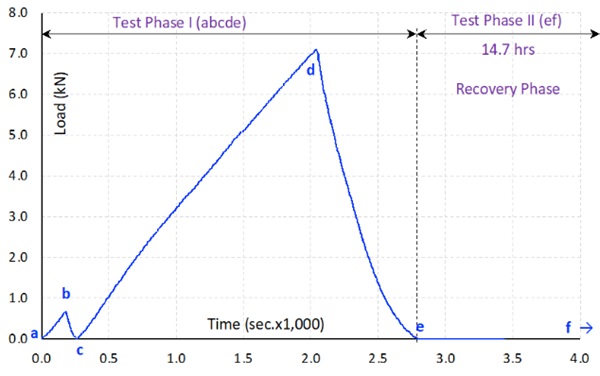
The load protocol is shown in Fig. 7 and is described as follows: a minimal seating load was applied of 0.71 kN (10% of max. load) at a displacement rate of 0.20 mm/min (Points a-to-b in Fig. 7), followed by an unloading ramp at a displacement rate of 0.40mm/min to zero load (Points b-to-c in Fig. 7). Next load was applied to 100% of service (7.1 kN) at a displacement rate of 0.20 mm/min (Points c-to-d in Fig. 7), followed by unloading to zero load at 0.40 mm/min (Points d-to-e in Fig. 7). This concluded the service load test and is referred to as Test Phase-I in Fig. 7, during which data was acquired continuously at a rate of 10 Hz. However, to understand a bit of how the bridge would recover in-time (from the imposed service load or Test Part-I ) following Point e in Fig. 7, data acquisition continued (under zero load) a rate of 0.5 Hz for 14.7 hours ending at point f. This is referred to as Test Phase-II or Recovery Phase in Fig. 7.
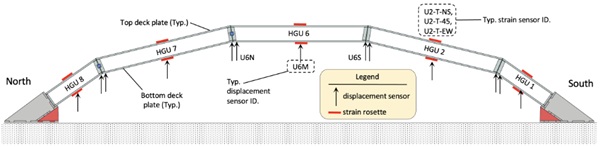
Instrumentation is shown in Fig. 8 and consisted of 13 vertical displacement sensors and 10 strain rosettes, all located on the NS centreline. Displacement sensors were located on the bottom deck plate and at the centre, N- and S-edges of HGUs 2,6, and 7. For HGU 1 and 8 displacement sensors were placed at the centre and edge on the span side. These displacement sensors are identified as “U#i”, where “#” is the HGU number (1, 2, 6, 7, or 8) and “i” is either M, N, or S and represents location as middle, north edge, or south edge, respectively. Furthermore 0-45-90 strain rosettes were placed on the centroid of the outside surfaces of top and bottom deck plates, as shown in Fig. 8. Strain sensor ID is of the form “U#-j -k” where “#” is the HGU number (again 1, 2, 6, 7, or 8), “j” is T or B and represents top or bottom deck plate, and “k” is either NS, EW, or 45 and represents the direction of strain measurement.
4. Test Results
The load-displacement and load-strain results for HGU-6 are shown in Fig. 9a and 9b, respectively, where it is noted that positive displacement correlates to push or downward displacement. As can be seen in Fig. 9a the displacements at the south and north sides are approximately equal with a maximum value of about 5.5 mm downwards. This corresponds to span length L divided by 610, or L/610, which is well below the unfactored pedestrian live load deflection limit of L/360 (AASHTO, 2009).
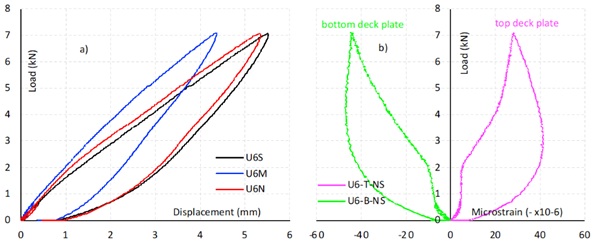
In comparison, the displacement at the centre of HGU-6 is measurably less, with a maximum value of about 4.35 mm, or about 20% less. This could be a consequence of second order bending in the bottom deck plate associated with flexural buckling. This bending sense would have curvature resulting in compression on the bottom deck plate outside surface. This speculation is confirmed in Fig. 9b, where strain measured on the bottom deck plate is seen to be compression. As for the load-displacement shape, it is slightly nonlinear with decreasing stiffness between 0-and-2 kN. This is followed by a relatively stable linear region between 2-and-7 kN. The results suggest all joints are closed and the structure is behaving linearly. Upon unloading there is a minor residual displacement of between .78 (U6M) and 0.97 mm (U6N). This is likely the result of joints closing during initial loading resulting in a minor permanent displacement.
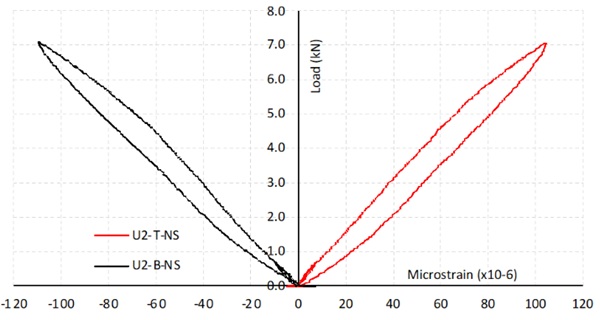
The highest tensile and compression strains measured for all 10 strain rosettes were recorded on HGU-2 top (max. tensile) and bottom (max. comp.), both in the north-south direction, and are shown in Fig. 10. The strains are seen to have a roughly linear rate with a maximum value of about 105 me tension and 110 me compression. Using Young’s Modulus for float glass (E) as 70 GPa, the corresponding maximum normal tension and compression stress in the NS direction is 7.35 and 7.70 MPa, respectively.
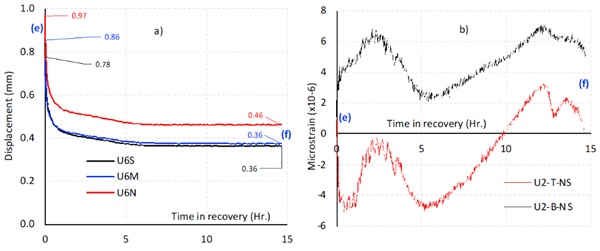
The recovery of the bridge was measured for 14.7 hours following unloading as is shown as Phase-II in Fig. 7, and the displacement-time and strain-time results for sensors U6S, U6M, U6N and U2-T-NS, U2-B-NS are shown in Fig. 11a and 11b, respectively. As is noted in Fig. 11a, there is a steep nonlinear displacement recovery in about the first 3 hours, this is followed by an increasingly stable phase ending flat at 14.7 hours. The percent change in displacement over the 14.7 hour recovery period is -54, -58 and -53% for U6S, U6M and U6N, respectively, with the majority of this recovered displacement occurring in the first 3 hours. Thus, the bridge is rebounding upwards (positive displacement getting smaller) towards its original position over this recovery period. The strains measured over the recovery period show a very different behaviour with an oscillating change. Note these are microstrain changes and are very small, on the order of +/- 4 me maximum, and likely the result of temperature change in the laboratory during the 14.7 hour recovery period.
5. Conclusions and Findings
In this research a 3.3 m span all glass shell structure was tested under monotonic loading conditions. The bridge consists of 13 individual hollow glass units (HGU) that are geometrically arranged to form a compression dominant structural system. The shape of the structure is determined using Three Dimensional Polyhedral Graphic Statics. The bridge is built using modular construction technology employing interlocking connections between neighbouring HGUs. This structure represents a small-scale prototype of a proposed 10 m span pedestrian bridge built using the same modular technology. The highest force magnitude applied to the structure during testing represents the service limit state and correlates to a pedestrian live load of 4.0 kN/m2. The following findings and observations are offered:
- The bridge behaved in a linear fashion as related to displacement of the midspan HGU with a maximum displacement of 5.5 mm. The displacement under live load normalized to span length L was L/610.
- Displacement at midspan of HGU6 was 20% less than displacements at the N and S edges. This suggests second order bending associated with flexural buckling. Measured strain confirmed this behaviour and bending curvature.
- The maximum measured tensile and compression strains were 105 and 110 microstrain, respectively. Using a Young’s Modulus for float glass of 70 GPa this corelates to tension and compression stress as 7.35 and 7.70 MPa, respectively.
- Displacements measured on the middle HGU at the end of load testing were between 0.78 and 0.96 mm. These displacements were monitored over a 14.7 hour period following the end of load testingand is referred to as a recovery phase. It was found that about 55% of the end of load testing displacement was recover in the 14.7 hour recovery phase, with the majority of this recovery happening in the first 3 hours.
- The displacement and strain results presented in this study confirm the feasibility of using the proposed modular HGU technology for construction of a full-scale span pedestrian bridge.
Future experimental work on Tortuca will include additional symmetrical service load testing as well as asymmetric testing where only one joint of HGU-6 is loaded.
Acknowledgements
This research was partially supported by the National Science Foundation Future Eco Manufacturing Research Grants NSF, FMRG-2037097 CMMI and NSF CAREER-1944691 CMMI and the Advanced Research Projects Agency–Energy (ARPA-E) Grant of the U.S. Department of Energy (DE-AR0001631) awarded to Dr. Masoud Akbarzadeh. Also, this study was supported by Villanova University CEE Department Graduate Assistance Resource Support to Dr. Joseph Robert Yost. The multi-axis milling, metalwork, and other facilities necessary for fabrication of Tortuca were generously supported by Eventscape, NYC.
References
Akbarzadeh M., Van Mele T., Block P.: On the equilibrium of funicular polyhedral frames and convex polyhedral force diagrams. Comput Aided Des. 63, 118–28. (2015)
Akbarzadeh, M.: 3D Graphical Statics Using Reciprocal Polyhedral Diagrams. Ph.D. thesis. ETH Zurich CHE (2016).
Akbarzadeh M, Bolhassani M, Nejur A, Yost J R, Byrnes C, Schneider J: The design of an ultra-transparent funicular glass structure. Proceedings ASCE Structures Congress. Orlando, Florida USA (2019). https://ascelibrary.org/doi/pdf/10.1061/9780784482247.037
American association of state highway transportation officials (AASHTO): LRFD Guide Specification for the Design of Pedestrian Bridges. Washington D. C. USA (2009)
Bolhassani M., Akbarzadeh M., Mahnia M., and Taherian R.: On structural behavior of a funicular concrete polyhedral frame designed by 3D graphic statics. Structures. 14, 56–68 (2018).
Lu, Y., Seyedahmadian, A., Chhadeh, P. A., Cregan, M., Bolhassani, M., Schneider, J., Yost, J. R., Brennan, G., and Akbarzadeh, M.: Funicular glass bridge prototype: Design optimization, fabrication, and assembly challenges. J. Glass Structures & Engineering. 7, 319-330 (2022).
3M VHB, Structural glazing tape: (2021). https://www.3m.com/3M/en_US/p/d/b40072022/
Surlyn (2024.) https://www.dow.com/en-us/pdp.surlyn-8940ionomer.1892363z.html#overview
Yost J. R., Bolhassani M., Chhadeh .P A., Ryan L., Schneider J., Akbarzadeh M.: Mechanical performance of polyhedral hollow glass units under compression. Engineering Structures. 254, 1-16 (2022a). https://doi.org/10.1016/j.engstruct.2021.113730.
Yost J. R., Cregan, M., Bolhassani M., Akbarzadeh M., Lu, Y., Chhadeh P. A., Schneider J.: Experimental investigation of a transparent interface material for glass compression members. Proceedings Challenging Glass 8. Ghent, BEL. (2022b)


 demonstrator at Glass Technology Live during Glasstec 2024 (© Cas Maertens).")