This paper was first presented at GPD 2019 by E. Mognato, P.P. Bazzacco, S. Brocca and A. Barbieri.
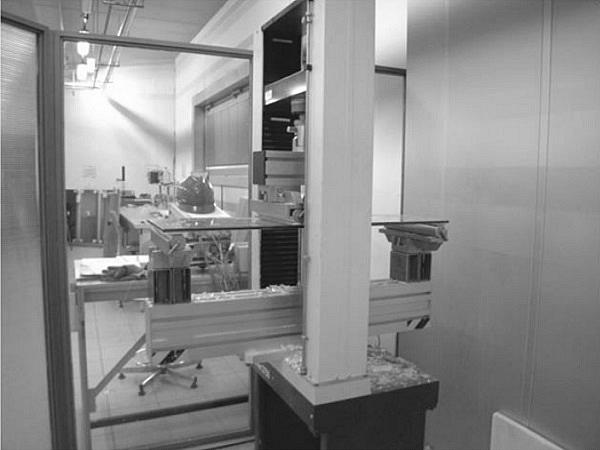
The first one (Scalp) measures SC at tin and air side. It is a compact scattered light polariscope for depthwise stress measurement in sheet glass. Scalp-05 contains diode laser, optics and camera. Recording of the data and stress calculation is done by PC. The second one (Laser Gasp) is also well known at glass industry and it is able to measure the SC at the tin side, giving an information of surface stress. The SC measurements were carried out on both the surfaces by Scalp-05 and on tin side with Laser Gasp.
Introduction
Thermally treated glass is used in many applications and the range of glass products is quite wide, considering the range of applications that are used in the architectural world.
Nowadays coated glass panes are widely applied to respect energetic parameters: low-e, selective and reflective glass in function of the climatic zone and law requirements for specific projects.
The measure of residual stress has to be carried on by photoelastic measurement, which has been widely developed in the recent years. Nowadays, the main instruments are: 1) GASP, registered trademark of Strainoptics Technologies; 2) SCALP, developed by GlasStress Ltd.
SSV carries out many experimental tests on all these products. The data are collected to evaluate a correlation between the Surface Compression Stress (SC) [1] and other characteristics: Fragmentation (FR) [2] and Flexural Bending Strength (BS) [3]. This database is continuously improved and other papers have been published on this topic [4, 5, 6].
The measurement is carried on to evaluate the SC and correlate this non-destructive measure with the BS or FR values carried out by destructive tests. Redner wrote many papers on this topic [7, 8, 9, 10, 11, 12] explaining the features of GASP instrument and its capability to be used in QC after glass tempering. Other authors proposed a new instrument (SCALP) based on scattered light polariscope technique [13, 14] evincing that the residual stress in tempered glass can be highly inhomogeneous, both locally and globally.
The aim of this paper is also to compare the results of SC evaluated by Scalp-05 and Laser Gasp considering the tests carried out in 2018, year in which the two instruments were used together.


Asymmetric stress induced by thermal process
The soda lime silicate glass HS (conform to [15]) or TT (conform to [2, 16]) is a glass in which permanent surface compressive stress was induced through a controlled process of heating and cooling to increase mechanical and thermal strength; for TT product, in addition, to get the fragmentation characteristics such as to limit the damage to people and/or things in case of its failure.
Nowadays, during tempering process, the convention plays a crucial role also due to the introduction of low-e glass in the market: the presence of a face with lower emissivity or incorrect process execution, even for uncoated glass, may involve an asymmetrical cooling velocity (due to heating or cooling) resulting in bowing of the pane at the end of the treatment, with possible no homogeneous residual stresses between the two faces.

Typology of tested material
The comparison between the two instruments was carried out on 412 specimens of flat heat treated glass with dimensions 1100 mm x 360 mm kept by different producers according (Tab. 1):
- EN 12150-1 [2] thermally toughened glass (306 specimens: 236 clear; 70 coated with ε=0.89);
- EN 1863-1 [15] heat strengthened glass (106 specimens: 69 clear; 37 coated of which 11 with ε=0.01 and 26 with ε=0.03).
The surface compression stress was measured at 5 points on tin side by Laser Gasp and Scalp and at the corresponding 5 points on the air side by Scalp. A total of 15 measurements were taken for each specimen.
The authors evinced some difficulties to measure with Scalp the specimens with the lowest emissivity, probably due to high reflectance of coating. For example, three samples of heat strengthened specimens, sent by two different producers, were measured with both instruments. In one case (ε=0.01), it was not possible to measure the surface compression stress on the air side, which coincides with the coated side; in the other two samplings (ε=0.03) the values recorded on the same side were very high: 100% higher than that recorded on the tin side (no coated). The specimens were flat and not bent, so that asymmetrical stress state was excluded. The difficult of measurements was probably due to type of coating.
In the following table the specimens number and typology used for all the tests are reported.
Comparison of surface compression stress
The two groups of specimens, thermally toughened (Fig. 2a) and heat strengthened (Fig. 2b) are considered separately, taking into account only float specimens, and the correlation between the two side, air and tin, for Scalp measurements seems good enough, in particular for TT specimens.


Likewise considering only the tin side, the correlation can be done between Scalp vs Laser Gasp, considering float glass (Fig. 3a, 3b).


For coated glass panes see Fig. 4a, 4b; in this last case the measurements on tin side corresponded to no-coated side. Also in these cases TT and HS were considered separately and the results seem good too.


The correlation between measurement on tin side and air side, for coated TT specimens with ε=0.89, carried out by Scalp is plotted in figure 5. The R² value is lower than that evaluated for float specimens (Fig. 2a: R²=0.96); probably, this is due to the presence of coating on air side, which modifies the surface properties of glass slightly. Considering the coated HS tested specimens, the correlation was not carried out because, as written previously, the SC recorded values on air/coated side were 100% higher than these of tin side, without bowing of panes.

Fragmentation vs Surface Compression stress
The specimens were tested according EN 12150-1 [2] to evaluate the conformity to fragmentation for TT glass (TT specimens were 125 of which 35 were coated glass). The results are plotted in figure 6, considering the two instruments and side of measurement. The fragmentation limit value, defined by the Standard [2], is 40 fragments.
The heat strengthened specimens were tested according EN 1863-1 [15] (HS were 45 of which 10 were coated glass). In this case the fragmentation is assessed regarding presence of particle (A < 100 mm²) and island (A ≥ 100 mm²), experimentally evaluated in term of weight. All the values found for HS are reported in table 2; between these values the fragmentation was conform.


Bending Strength vs Surface Compression stress
The specimens were tested according EN 1288-3 [3] to evaluate the bending strength of TT glass (TT specimens were 142 of which 20 were coated glass) and HS glass (HS specimens were 56 of which 22 were coated glass). The results are plotted in figure 7.
All the samples were conform respect the minimum value of mechanical strength declared in the specific Standards: EN 12150-1 [2] for TT (120 N/mm²) and EN 1863-1 [15] for HS (70 N/mm²). The two typologies of thermally treatment are clearly distinguished from each other looking to the SC values. The correlation is similar considering the two instrument as surface side of measurement.

“Asymmetrical?”
The authors tried to create some unequilibrated specimens modifying the production parameters in a oven during different production days. The SC measurements were carried out and the bowing effect was evaluated measuring the rise of curved specimens. The data are reported in table 3.
Considering the specimens with high value of overall bow, the difference in terms of SC between tin and air sides seems no significant except for specimens 9-10-17-19 where is more than 10 MPa.

Conclusions
The correlation between the two instruments (Laser Gasp and Scalp) proved to be satisfactory, considering the different sides verified and the types of glass tested.
Considering TT specimens, the SC limit value to have a good compliance with the fragmentation is about 90 MPa, while for the mechanical resistance is highlighted in figure 7 and it is about 85 MPa. Considering the tested HS specimens, the found SC range of their conformity in FR is in table 2: min 29-35 MPa; max 54-57 MPa. For FB the minimum value is about 30 MPa.
All these values are in good accordance with our previous papers. The attempt to produce glass specimens with different surface compression stress between the two sides, “forcing” the production parameters, gave values with differences not high despite the very high overall bow.
References
[1] ASTM C1279:2013, Standard Test Method for NonDestructive Photoelastic Measurement of Edge and Surface Stresses in Annealed, Heat-Strengthened, and Fully Tempered Flat Glass.
[2] EN 12150-1:2015, Glass in building - Thermally toughened soda lime silicate safety glass - Part 1: Definition and description.
[3] EN 1288-3:2000, Glass in building - Determination of the bending strength of glass - Part 3: Test with specimen supported at two points (four point bending).
[4] Redner A.S., Mognato E., Schiavonato M., Correlation between strength and measured residual stress in tempered glass products, J. of ASTM Int., Vol. 2, No. 3, 2005.
[5] Mognato E, Barbieri A., Schiavonato M., Pace M., Thermally toughened safety glass: correlation between flexural strength, fragmentation and surface compressive stress, GPD, 2011, pp. 115-118.
[6] Mognato E, Brocca S., Barbieri A., Thermally Processed Glass: Correlation Between Surface Compression, Mechanical and Fragmentation Test, GPD, 2017, pp. 169-175.
[7] Redner A.S., On-line measurement of stresses and optical distortion of QC of tempered glass, GPD, 2003, pp. 388-390.
[8] Redner A.S., Automated measurement of edge stress in automotive glass, GPD, 2003, pp. 578-579.
[9] Feingold J. M. and Redner A.S., New PC-based scanners improve quality and productivity for glass fabricators, Int. Glass Review, Issue 1, 2003, pp. 63-66.
[10] Redner A.S., Hoffman B.R., Measuring stresses and optical distortion for QC of automotive glass, GPD, 1997, pp. 385-389.
[11] Redner A.S., Hoffman B.R., Detection of tensile stresses near edges of laminated and tempered glass, GPD, 2001, pp. 589-591.
[12] Redner A.S., Bhat G.K., Precision of surface stress measurement test methods and their correlation to properties, GPD, 1999, pp. 169-171.
[13] Anton J., Errapart A., Paemurru M., Lochegnies D., Hödemann S., Aben H., On the inhomogeneity of residual stresses in tempered glass panels, GPD, 2011, pp. 119-121.
[14] Aben H., Anton J., Paemurru M., Õis M., A new method for tempering stress measurement in glass panels, GPD, 2013, pp. 216-217.
[15] EN 1863-1:2004, Glass in building - Heat strengthened soda lime silicate glass - Part 1: Definition and description.
[16] EN 14179-1:2016, Glass in building - Heat soaked thermally toughened soda lime silicate safety glass - Part 1: Definition and description.


