Article Information
- Digital Object Identifier (DOI): 10.47982/cgc.9.585
- Published by Challenging Glass, on behalf of the author(s), at Stichting OpenAccess.
- Published as part of the peer-reviewed Challenging Glass Conference Proceedings, Volume 9, June 2024, 10.47982/cgc.9
- Editors: Christian Louter, Freek Bos & Jan Belis
- This work is licensed under a Creative Commons Attribution 4.0 International (CC BY 4.0) license.
- Copyright © 2024 with the author(s)
Authors:
- Evelien Symoens - Ghent University
- Ruben Van Coile - Ghent University
- Jan Belis - Ghent University

Abstract
Assessing the fire performance of structural materials is crucial for ensuring the safety and integrity of buildings and structures. Traditionally, this assessment involves expensive and time-consuming physical fire tests. However, an alternative cost-effective approach is numerical modelling, which requires a deep understanding of heat transfer mechanisms specific to the material of interest. While numerous models exist for opaque materials, modelling glass in fire conditions presents additional complexities due to its transparency and wavelength-dependent heat transfer characteristics. This paper presents an experimental campaign employing an electric radiant panel as the heat source to investigate the heat transfer phenomena in glass. The radiant panel consists of 21 emitters capable of producing a uniform radiative heat flux on glass specimens of different thicknesses. The experimental results allow us to derive spectrum-averaged values for the transmittance, the absorptance, and the reflectance specific to the glass material. These values are essential for accurate fire simulations, understanding heat transfer through glass, and quantifying the transmitted radiation through the glass, which is critical to the combustible materials on the unexposed side of the glass component exposed to fire.
1.Introduction
In recent years, tragic fire incidents have highlighted the critical necessity for safe building materials to effectively block the spread of smoke and fire while maintaining structural integrity. Consequently, assessing the performance of different building materials in fire scenarios has become a key research field. Traditionally, this evaluation involves expensive and time-consuming physical fire tests. However, an alternative cost-effective approach is numerical modelling.
The process of numerically simulating the behaviour of a structural element in a fire can be broken down into three main steps. First, a fire model is created to generate fire dynamics, producing outputs such as heat fluxes and fire temperatures. These outputs are then used for a thermal model, characterising temperature profiles and evolutions within the structural element. Finally, a structural model is developed to combine the temperature evolution and mechanical loads, providing an overall understanding of the element's behaviour under fire conditions (Choi, 2008; Wang et al., 2012).
The fire model depends on the room geometry, lining thermal properties and fuel availability and is somewhat independent of the material of the structural element. Consequently, fire models developed for traditional materials like concrete and steel can generally be applied to various materials. However, this is not the case for the subsequent thermal model, which focuses on heat transfer within the material and thus demands a nuanced understanding of material-specific heat transfer mechanisms (Drysdale, 2011).
Several experimental campaigns have been conducted to elucidate and characterise heat transfer phenomena in building materials. While opaque materials such as concrete, wood, steel, and gypsum have received considerable attention (Liu et al., 2018; Narang, 2005; Shin et al., 2002; Weber, 2012), research concerning transparent building materials like glass remains relatively scarce because of additional complexities (Debuyser et al., 2017; Honfi et al., 2022; Symoens et al., 2020). For opaque materials, all incoming radiation is reflected and absorbed at the exposed surface, while for transparent materials, incoming radiation is additionally partially transmitted through the exposed surface and even the entire element (Debuyser et al., 2017). Moreover, since transmission varies with wavelength, the thermal model of transparent materials necessitates a wavelength-dependent approach.
One approach to addressing these complexities in the thermal model involves utilising experimentally derived spectrum-averaged values for the transmittance, the absorptance, and the reflectance. This paper describes an experimental campaign designed to determine these spectrum-averaged values, with the aim of incorporating them into future numerical models. The experimental setup involves exposing monolithic glass specimens of varying thickness to radiant heat emitted from an electric radiant panel equipped with 21 emitters capable of producing a uniform radiative heat flux. Simultaneously, surface temperatures and heat fluxes are measured at different positions, enabling the derivation of the transmittance, the absorptance, and the reflectance.
2. Materials
2.1. Glass specimens
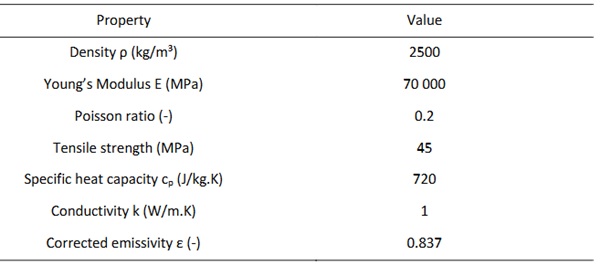
The experimental campaign utilises monolithic annealed soda-lime-silica glass specimens, each with a 300 x 200 mm surface area. The specimens have different thicknesses (6, 10, and 12 mm). Table 1 provides an overview of the specimen numbering used in this campaign. The relevant mechanical, thermal, and optical properties of the glass specimens at 20°C are summarised in Table 2.
Table 1: Glass specimens overview.
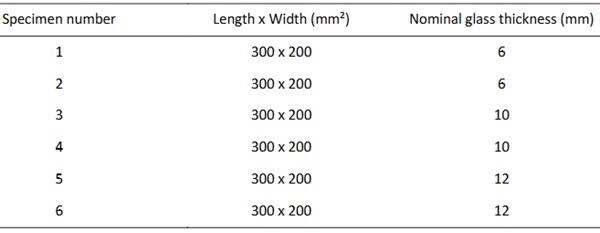
Table 2: Material properties for annealed soda-lime-silica glass (NBN EN 572-1, 2004; NBN EN 673, 2011).
2.2. Thermocouples
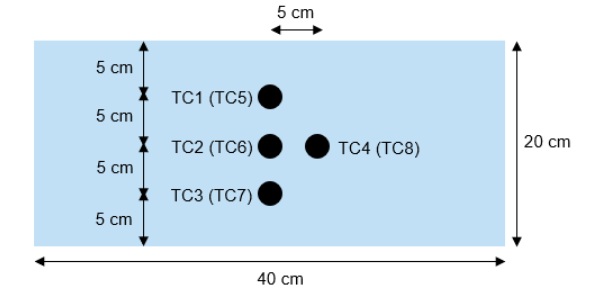
During the experiments, the glass specimens' surface temperatures are monitored by employing K-type thermocouples with dimensions of 2x0.5 mm diameter. Before applying these thermocouples, a cleaning procedure is carried out using an alcohol-based cleaning agent to ensure the clean condition of all glass specimens. Eight thermocouples are attached to each specimen, with four thermocouples on both the exposed and unexposed surfaces, as illustrated in Figure 1. All thermocouples are strategically arranged within the central region of the specimen, thereby mitigating potential effects arising from edge-induced heat dissipation in the temperature measurements.
The thermocouples are connected to the glass surface using aluminium tape, which requires carefully chosen tape dimensions. On the one hand, the opaque tape disturbs the glass's transparency and caninduce localised cold spots, requiring the minimisation of the size of the tape. On the other hand, the stripped wire of the thermocouple must be effectively shielded from direct radiation of the radiant panel, requiring the size of the tape to be large enough. In light of these considerations, empirical investigations conducted by Jorgenson (2018) have proven that using a circular aluminium tape with a diameter of 10 mm is an optimal compromise (Jorgensen, 2018). Furthermore, to prevent refractive influences of direct radiation upon the stripped wire of the thermocouple, an additional layer of aluminium tape with a diameter of 10 mm is positioned at the interface between the glass surface and the thermocouple.
2.3. Heat flux gauge
In the experiments, several heat fluxes are measured via a heat flux gauge (Hukseflux SBG01, water-cooled). This gauge can capture heat fluxes reaching up to 200 kW/m² in the spectral range of 0 to 50 μm. The gauge is equipped with a black absorber, specifically designed for measurements in an environment where radiation dominates the heat flux.
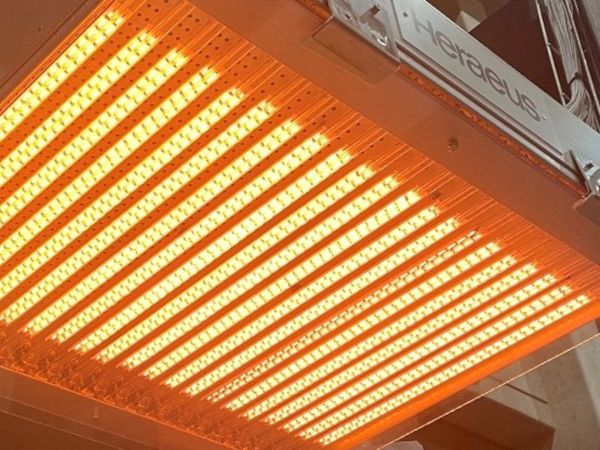
2.4. Radiant panel
The radiant panel features densely arranged infrared emitters, each comprising a thin tungsten filament encased within a protective quartz glass tube. The rear surface of the glass tube is covered with a reflective quartz coating, efficiently redirecting all the radiation to the front of the panel. An illustration of the radiant panel and its emitters is presented in Figure 2(a), with a detailed illustration of the emitters provided in Figure 2(b).
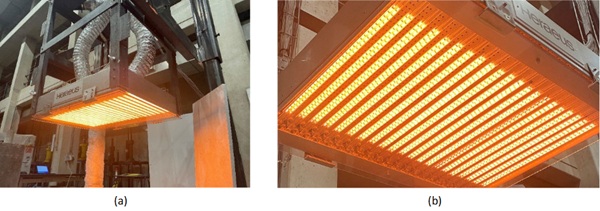
The radiative heat flux is created by passing a current through the tungsten filaments. They heat up and emit heat with wavelengths ranging from 0.3 μm to 5 μm, peaking at approximately 1.1 μm. The resulting thermal boundary condition can be precisely controlled by adjusting the current through the filaments, which is quasi-instantaneously translated into a change in radiative intensity. An additional quartz glass plate is positioned between the emitters and the tested specimens to protect the radiant panel from unforeseen events during testing.
While the radiant panel is designed to simulate fire exposure, it is crucial to maintain a relatively cool operating temperature to prevent damage to its components. This is achieved through an air cooling system. After cooling the emitters, the air stream is deflected by the protective quartz glass plate at the front of the panel. This strategic deflection minimises the system's influence on the convective flows around exposed specimens.
The panel's calibration shows that a uniform heat flux of over 100 kW/m² can be reached in the centre of the panel when operating at 100% intensity. Beyond this central zone of 50 cm by 30 cm, the heat flux diminishes proportionally according to the reduction of the view factor.
3. Methods
3.1. Test setup
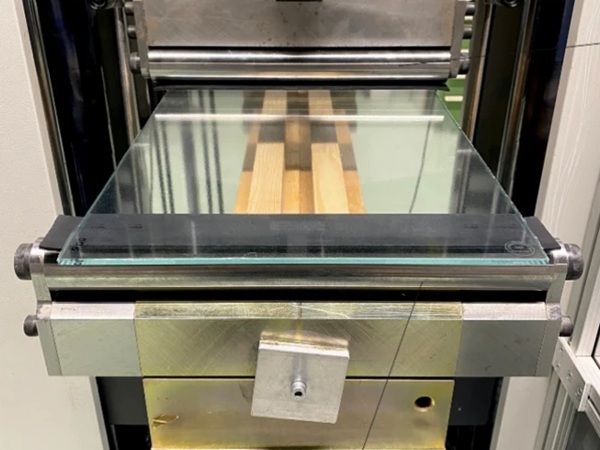
The monolithic glass specimens of Table 1 were tested in an experimental setup, as illustrated in Figure 3. Supported by two longitudinal steel beams at the edges, each glass specimen was aligned to ensure the central axis of its exposed surface coincided with that of the radiant panel, precisely situated at a distance of 42 cm from the panel. Direct contact at the interface between the glass specimen and the supporting steel beams was prevented by insulation material, of which the contact area between the glass specimen and insulation material was minimised to avoid thermal fractures during the tests.

Furthermore, insulation boards were strategically placed along the free edges of the glass specimen to ensure one-dimensional heat transfer. At the inner sides of the steel beams, insulation blankets were deployed to prevent the heated beams from emitting additional heat fluxes to the glass specimen. Centrally behind the glass specimen at the unexposed side, a heat flux gauge was positioned to capture the transmitted heat flux throughout the experiment. The heat flux measurements will be described in more detail later.
3.2. Test procedure
The test procedure for a single glass specimen consists of three consecutive steps, as illustrated in Figure 4. In the first step, as presented in Figure 4(a), no glass specimen is present in the setup with the heat flux gauge positioned at a designated distance of 42 cm. This distance represents the distance at which the exposed surface of the glass specimen will be placed during the third step in the testprocedure. Subsequently, upon activating the radiant panel, the heat flux at a distance of 42 cm is measured until a steady state is reached, denoted as ‘HF1’. The radiant panel is put on an intensity of 60%, resulting in a target heat flux of 30 kW/m² at a distance of 42 cm. Initially, the protective quartz glass plate absorbs a part of the target heat flux, causing an initial reduction in heat flux of 13%. The quartz glass plate heats up in time, causing an additional radiative heat flux. When a steady state is reached, the resulting heat flux of the tungsten filaments and the quartz glass plate equals the initial target heat flux of 30 kW/m² +- 2%.
Subsequently, the panel is allowed to cool down, after which the heat flux gauge is repositioned to a distance of 53 cm, as depicted in Figure 4(b), representing the position at which the transmitted heat flux will be measured during the third step in the test procedure with the glass specimen present. Again, the panel is activated at the same intensity as before, and the heat flux measurement is conducted until a steady state is reached, defined as ‘HF2’.
Lastly, after a cooldown period, the heat flux gauge remains at the 53 cm mark. The glass specimen is positioned with its exposed surface at 42 cm from the radiant panel, as sketched in Figure 4(c). After panel activation at the same intensity as before, the thermocouples monitor the glass specimen’s surface temperatures. The heat flux gauge behind the glass specimen records the transmitted heat flux until the thermocouples reach a steady state, denoted as ‘HF3’.

3.3. Data analysis
The glass surface temperatures and heat flux time series are analysed within the framework of one-dimensional heat transfer assumptions (Welty, 2008) to derive spectrum-averaged values for the transmittance, the absorptance, and the reflectance.
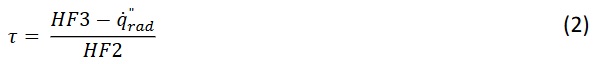
The transmitted heat flux is computed as the residual value of HF3 after deducting the radiative heat flux from the emitting unexposed glass surface. This heat flux can be estimated utilising the surface temperature measurements in conjunction with Equation (1).
![]()
with 𝑞̇"𝑟ad (W/m²) the radiative heat flux from the emitting glass surface, 𝐹 (-) the view factor, 𝜀 (-) the emissivity, 𝜀 (5.67∙10⁻⁸ W/m²K⁴) the Stefan-Boltzmann constant, and 𝑇surface (K) the absolute temperature of the emitting glass surface.
Assuming absorption and emission effects are lumped at the surface, the transmittance is determined by the ratio of the transmitted heat flux to HF2, as shown in Equation (2).
The absorbed heat flux is calculated as the sum of three parts: the heat flux responsible for the glass specimen's temperature increase, determined by Equation (3); the radiative losses by emission for both the exposed and the unexposed surfaces of the glass specimen, defined by Equation (1); and finally, the convective losses at these surfaces, calculated according to Equation (4).

with 𝑞̇"𝑎b𝑠 (W/m²) the absorbed heat flux to achieve the rate of temperature increase ∆𝑇̇ (K/s) in the glass volume, 𝐴 (m²) the area of the exposed glass surface, 𝑚 (kg) the mass of the glass volume, and c𝑝 (J/kg K) the specific heat capacity.
![]()
with 𝑞̇"𝑐onv (W/m²) the convective heat flux, ℎ (4 W/m²K) the convective heat transfer coefficient, and 𝑇surface and 𝑇air (K) the absolute temperature of the glass surface and the air, respectively.
Again, assuming that the absorption and emission effects are lumped at the surface, the absorptance is derived from the ratio of the absorbed heat flux to HF1, as shown in Equation (5).

Once the transmittance and the absorptance are calculated, the reflectance is derived from the energy balance in Equation (6).
![]()
with 𝜌 (-) the reflectance, 𝜏 (-) the transmittance, and 𝛼 (-) the absorptance.
To exclude the influence of the protective quartz glass plate heating up, as discussed in the test procedure in Section 3.2, the spectrum-averaged values for the transmittance, the absorptance, and the reflectance are determined at the initial heating phase when the protective quartz glass plate is still at room temperature.
4. Results and Discussion
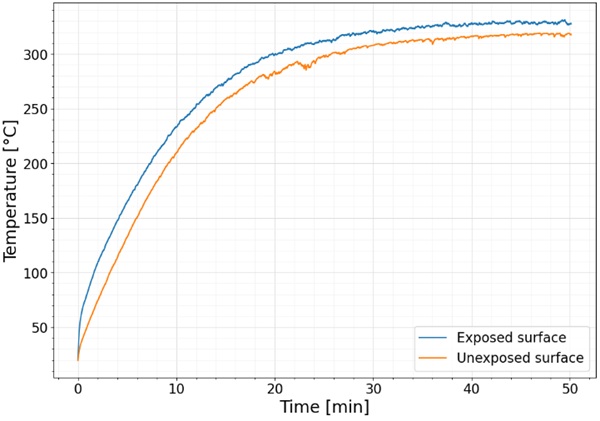
The duration required to achieve steady-state temperatures of the exposed and unexposed glass surface varied across specimens, with exposure times spanning 26, 38, and 44 minutes for 6, 10, and 12 mm thicknesses, respectively. During these exposure times, no thermal fractures occurred, confirming a successful design of the radiant panel setup for future testing. In Figure 5, the temperature-time curve of specimen 5 (nominal glass thickness of 12 mm) is illustrated as an example.
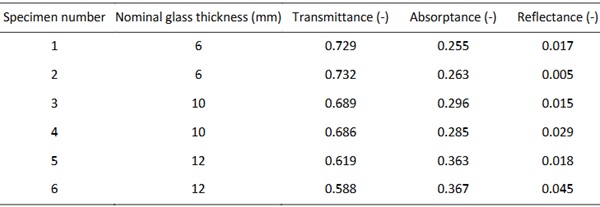
The spectrum-averaged values for the transmittance, the absorptance, and the reflectance for each test are calculated following the prescribed methodology outlined in Section 3.3, with the obtained results tabulated in Table 3.
A preceding experimental study by Debuyser et al. (2017) presented transmittance values of 0.263, 0.250, and 0.175 for a thickness of 6, 10, and 15 mm of monolithic glass, respectively. A comparison with this study shows that the calculated transmittance values in Table 3 are generally higher. This difference highlights the pronounced influence of spectral characteristics inherent to the employed heat source. The electrical radiant panel used in this study demonstrates a relatively confined spectral range (0.3 μm to 5 μm), peaking at approximately 1.1 μm. Most of this spectrum aligns closely with the wavelength domain wherein glass exhibits maximal transmission (~80%), resulting in high transmittance values. Conversely, Debuyser et al.’s study (2017) utilises a gas-fuelled radiant panel with a broader spectrum, flattened towards some higher wavelengths. This wider spectrum consists of a higher portion in the wavelength domain wherein glass exhibits a transmission lower than 80%, thus allowing more absorption. This difference emphasises the importance of wisely employing spectrum-averaged values within numerical models, considering the corresponding spectrum of the heat source.
The similarity in the spectrum-averaged values of specimens with identical nominal glass thickness proves the electric radiant panel's reproducibility in establishing consistent thermal boundary conditions, creating repeatability in the results.
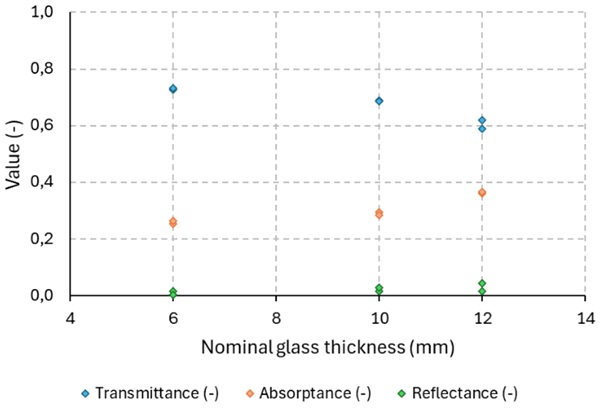
Figure 6 presents a graph comparing specimens of varying nominal thicknesses, revealing an increasing trend in the absorptance for increased thickness. This phenomenon arises from in-thickness absorption, whereby transmitted energy traverses a longer distance in thicker glass, during which the glass partially absorbs this transmitted energy through the thickness. Consequently, the transmittance decreases with increasing thickness.
In contrast to absorptance and transmittance, no visible trends can be derived from the reflectance values. Since the reflectance happens exclusively at the surface, these values are expected to occur in the same range regardless of the material thickness. Empirical findings documented by Rubin (1985) suggest that single-surface reflectivity at short wavelengths remains minimal (<0.05) (Rubin, 1985). Most of the radiation panel spectrum aligns within this range, so the derived reflectance values agree well with empirical observations.
Table 3: Derived spectrum-averaged values for the transmittance, the absorptance, and the reflectance.
5. Conclusions
This paper presents an experimental program to investigate spectrum-averaged values for the transmittance, the absorptance, and the reflectance, essential for integration into a future numerical thermal model, thereby facilitating the assessment of structural glass performance under fire conditions. Utilising an electric radiant panel as the heat source, thermal assessments were conducted on six monolithic soda-lime-silica glass specimens of varying nominal thickness (6, 10, and 12 mm) by monitoring glass surface temperatures and heat fluxes.
The findings demonstrate that all specimens successfully withstood exposure to an incident heat flux of 30 kW/m² +- 2% over 26, 38, and 44 minutes for specimens with a nominal glass thickness of 6, 10, and 12 mm, respectively, without experiencing fractures. This observation demonstrates the efficiency of the radiant panel setup, affirming its suitability for subsequent investigations.
The observed consistency in thermal boundary conditions and resultant outcomes across specimens of identical thicknesses emphasises the reproducibility facilitated by the electric radiant panel. Moreover, the analysis reveals a positive correlation between absorptance and nominal glass thickness, attributed to in-thickness absorption phenomena. This leads to a declining trend in transmittance with increasing thickness. Additionally, the reflectance values exhibit no apparent trend, consistent with the surface-confined nature of reflectance phenomena.
Furthermore, comparing the spectrum-averaged values for the transmittance, the absorptance, and the reflectance with previous studies highlights the importance of the spectrum knowledge of the heat source used in the radiant panel setup configuration.
Acknowledgements
Acknowledgements are expressed to Polypane Glasindustrie N.V. for providing glass specimens for use in the experimental program.
References
Choi, J. (2008). Concurrent fire dynamics models and thermomechanical analysis of steel and concrete structures. Georgia Institute of Technology.
Debuyser, M., Sjöström, J., Lange, D., Honfi, D., Sonck, D., & Belis, J. (2017). Behaviour of monolithic and laminated glass exposed to radiant heating. Construction and Building Materials, 130, 212–229.https://doi.org/10.1016/j.conbuildmat.2016.09.139
Drysdale, D. (2011). An introduction to fire dynamics (3rd ed). Wiley.
Honfi, D., Sjöström, J., Bedon, C., & Kozłowski, M. (2022). Experimental and Numerical Analysis of Thermo-Mechanical Behaviour of Glass Panes Exposed to Radiant Heating. Fire, 5(4), Article 4. https://doi.org/10.3390/fire5040124
Jorgensen, J. D. (2018). Window glazing exposed to high temperatures.
Liu, M., Sun, Y., Sun, C., & Yang, X. (2018). Study on thermal insulation and heat transfer properties of wood frame walls. ,.63(2), 249–260.
Narang, V. (2005). Heat transfer analysis in steel structures. Worcester Polytechnic Institute.
NBN EN 572-1. (2004). Glass in building—Basic soda lime silicate glass products—Part 1:Definitions and general physical and mechanical properties.
NBN EN 673. (2011). Glass in building—Determination of thermal transmittance (U value)—Calculation method.
Rubin, M. (1985). Optical properties of soda lime silica glasses. Solar Energy Materials, 12(4), 275–288. https://doi.org/10.1016/0165-1633(85)90052-8
Shin, K.-Y., Kim, S.-B., Kim, J.-H., Chung, M., & Jung, P.-S. (2002). Thermo-physical properties and transient heat transfer of concrete at elevated temperatures. Nuclear Engineering and Design, 212(1–3), 233–241. https://doi.org/10.1016/S0029-5493(01)00487-3
Symoens, E., Van Coile, R., & Belis, J. (2020). Behaviour of Different Glass Elements subjected to Elevated Temperatures – State of the Art. Challenging Glass Conference Proceedings, 7. https://doi.org/10.7480/cgc.7.4489
Wang, Y., Burgess, I., Wald, F., & Gillie, M. (2012). Performance-based fire engineering of structures. CRC press.
Weber, B. (2012). Heat transfer mechanisms and models for a gypsum board exposed to fire. International Journal of Heat and Mass Transfer, 55(5–6), 1661–1678. https://doi.org/10.1016/j.ijheatmasstransfer.2011.11.022
Welty, J. R. (Ed.). (2008). Fundamentals of momentum, heat, and mass transfer (5. ed). Wiley.