Article Information
- Digital Object Identifier (DOI): 10.47982/cgc.8.454
- This article is part of the Challenging Glass Conference Proceedings, Volume 8, 2022, Belis, Bos & Louter (Eds.)
- Published by Challenging Glass, on behalf of the author(s), at Stichting OpenAccess Platforms
- This article is licensed under a Creative Commons Attribution 4.0 International License (CC BY 4.0)
- Copyright © 2022 with the author(s)
Authors:
- Jürgen Neugebauer - University of Applied Sciences, FH Joanneum
- Georg P. Kneringer - University of Applied Sciences, FH Joanneum
Abstract
Due to climate change, there will be more extreme weather in the future, such as storms, heavy rain events in combination with hail, and the associated damage to various structural areas of our life such as hail damage to greenhouse envelopes. For this reason, it is important to deal with topics which range from the origin of the hail to the damage caused by hailstorms. The so-called hail resistance classes can be determined in a laboratory using suitable testing equipment and in this case these tests were carried out in the laboratory of the University of Applied Sciences FH Joanneum Graz. The results of the classification of hail resistance classes for different materials for greenhouse enclosures are presented in this paper.
1. Introduction
A greenhouse is a building, room, or area, covered mainly by glass, in which the temperature is maintained within a desired range, used for cultivating plants or growing vegetables out of season. Students of architecture in cooperation with the research project “Josef Ressel Centre for Thin Glass Technology for structural Glass Applications” have elaborated on new designs for greenhouses in various lectures and seminars. Figure 1 shows such a new greenhouse design.

All the different designs have in principle the same issue in relation to hail impacts. Figure 2 displays a couple of the worst examples of destruction caused by a hail impact scenario.

2. Formation of hail events
To describe the formation of hail, the microphysical processes that take place in the clouds should be considered. The so-called condensation nuclei are responsible for the formation of hail, clouds size anddistribution number. At a relative humidity of less than 100%, drops form on the condensation cores. When these drops join, they form different sized water droplets.
Updrafts and downdrafts in the clouds and the associated freezing processes build up very diverse forms of ice crystals, ranging from thin platelets to prisms. Homogeneous freezing of water droplets can take place only at a temperature below -40°C. As described above, water vapor can accumulate on the existing droplets and condense before freezing. Once the ice particles have reached a certain size, they continue to grow and become hailstones.
Strong dynamic processes in the clouds are required for these processes, as shown in Figure 3. The nuclei, also called embryos, are formed with the help of air movement which moves them both up and down and back and forth, increasing in the upward movement and partially melting them again in the downward movement (Wascher 2013).

3. Risk of hail impact
Climatic change of temperature and precipitation influences the risk and the level of destruction due to hail impact and leads to increasingly severe hail scenarios in the future.
3.1. Climatic background
Temperature
Anthropogenic amplification of the natural greenhouse effect will cause the global mean temperature to rise by the end of this century, as displayed in Figure 4. Based on various estimates calculated with global climate models, the global average temperature is expected to rise with values between about 1.5°C and 4.5°C. This robust assessment is based on extensive basic scientific work and is supported by a broad consensus in the scientific community (IPCC 2014).

Precipitation
Precipitation changes, as shown in Figure 5, will not be uniform in a warming world. In the high-latitudes and the equatorial Pacific the annual average precipitation is likely to increase by the end of this century. In many arid regions of the mid-latitudes and subtropics mean precipitation is likely to decrease, while in many humid mid-latitude regions it is likely to increase (IPCC 2014).

3.2. Hail risk assessment - TORRO
A scale was designed to capture the intensity of a tornado or strong wind event through Dr. Terence Meaden of the TORnado and Storm Research Organization -TORRO, a meteorological organization in Great Britain. Table 1 describes on an 11-point hail scale (H0 – H10), , the extent of damage of the respective classes in ascending order taking into account efficiency, hailstone diameter and the partial estimated kinetic energy in [J/m²] (ZAMG).
Table 1: Classification of hailstones according to TORRO.

3.3 Hail risk map - Austria
The basis for this zoning of the hail areas is the storm chronicle of the ZAMG (Central Institute for Meteorology and Geodynamics). Here, hailstorms with larger damage dimensions are used including the "TORRO-Hail Intensity Scale". Hail damage, hail intensities and hailstone sizes were included or classified into the map, as shown in Figure 6.
This provides the best possible representation of the regional hail hazard at the current time within Austria. All regions up to an altitude of 1500 meters are considered, as the highest concentration of agricultural and industrial goods exists there. (ZAMG)

4. Determination of the maximum speed of a ball of ice in free fall taking into account air resistance
For the assessment of the resistance against hail, the maximum velocity vmax according to equation (1)had to be determined in addition to the sizes of hailstones. With these parameters, the kinetic energy can be determined. The energy is in turn the basis for the classification into different hail resistance classes.

The maximum velocity vmax can be determined using the equation above. Where ρice is the density of ice, hH is the diameter of the ice ball, g the acceleration due to gravity, ρair the density of air, cw is the air drag coefficient.
The mass of the ice ball can be determined by the following equation (2).
![]()
With the mass mH and the maximum velocity vmax the kinetic energy Ekin can be determined using the following equation (3) (VKF).

5. Test set-up
Based on this hailstorm risk scenario, the investigation is focused on the following influences for the greenhouse cover.
- different materials for the greenhouse cover
- quality of glass float glass and chemically strengthened glass
- thicknesses of glass
5.1. Principle of testing
The concept of the test series is based on a test scenario described in the VKF (Vereinigung Kantonaler Feuerversicherungen - Association of Cantonal Fire Insurance Companies). Figure 7 shows the principles of the test set-up. The hail cannon is loaded with ice balls on the side where the magazine is located. Using air pressure, the ice balls are accelerated to a certain defined velocity and hit the test specimens at the impact points in defined areas at a distance between 0.3 and 1 m. One area with a diameter of 300 m is located in the center and the other one with a diameter of 50 mm is in the corner of the samples (VKF).

The velocity of the ice balls needed to determine the kinetic energy is measured at the end of the hail cannon via two laser beams at a certain distance. The mass of the ice balls is measured in advance of the filling process. The hail cannon in the laboratory with its different components is shown in Figure 8.

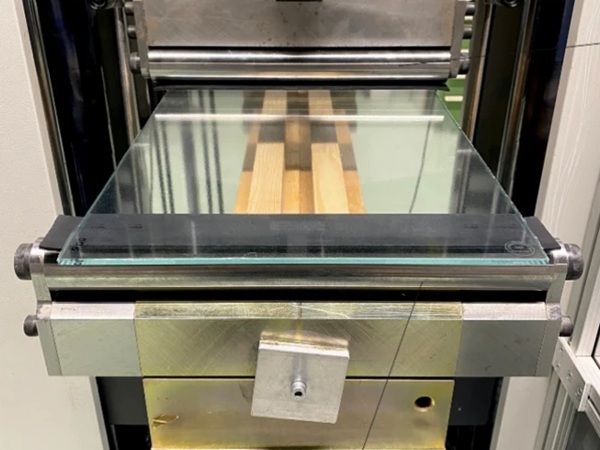
The test specimens are fixed with Velcro straps in heavy steel frames. The frames are fixed with steel angles and bolts the frames are fixed to a system of vertical and horizontal aluminium profiles - system ITEM. With this concept the position of the sample can be adjusted easily.
6. Different materials used for test series
Based on this risk of hail impact scenario, the research focuses on different materials for the greenhouse cover. By researching existing materials for greenhouse covers, a list of materials for testing was created.
6.1. Glass
Nowadays float glass is the most common type of glass in architectural applications. Through a process known as tempering, float glass is used in a variety of ways in the construction industry and is used, among other things, for windows, façade glazing, canopies or simply as mirrors. For several reasons a tempering of glass is necessary. With this tempering, a higher level of ultimate bending strength can be achieved. Due to the usage of thin glass a thermal tempering was not applicable. Therefore, chemical strengthening was used for the test series. The chemical tempering process is based on the principle of ion exchange of the alkaline ions near the surface. This process causes an internal stress state in the glass, with a compressive stress near-the surface and a tensile stress within the glass. With soda lime silicate glass, the Na+ - ions (sodium ions) are replaced by about 30% larger K+ - ions (potassium ions) and takes place in a KNO3 (potassium nitrate) bath.
6.2. Greenhouse film
The greenhouse film used in the experiments of this test series is a polyethylene foil. This material is one of the commonly used plastics worldwide and is mainly used in the packaging industry, but is also used in construction. Film stands out just like acrylic glass due to its low specific weight and light transmission. Disadvantages of this material can, however, be found in thermal insulation and soundproofing. Another weak point is the progressive embrittlement over time caused by environmental influences such as UV radiation.
6.3. Acrylic glass
Acrylic glass is one of the transparent plastics and is used alongside other plastics as a building product in facades, roof applications and greenhouses. In contrast to glass, the use of plastic glazing has some advantages. The two most significant are the easier machinability and the lower specific weight. However, acrylic glass or plastics in general also have disadvantages in comparison with glass - the lower modulus of elasticity, the lower surface hardness, the enormous drop in strength from around 70°C. and a clear disadvantage in the event of a fire. Another negative aspect is the escape of plasticizers from the plastics. UV radiation, in particular, (over many years) is a major contributory factor and leads to embrittlement of the material.
6.4. Twin-wall sheets
In addition to other materials, twin-wall sheets were used in the test series Areas of application of these sheets are mainly roofing and façade cladding, especially in smaller greenhouses for private use. However, twin-wall sheets can also be found in larger industrial greenhouses and even in stadium canopies.
Figure 10 displays the different materials used, which are fixed in the steel frames of the test set-up.

7. Results of test in laboratory
With the scenario described before, the series of tests were carried out in the laboratory. The simple procedure is defined in such a way that if a test item passes, the next step is to test the glass in the next higher hail resistance class. When a test sample reaches the highest-class HR 5, the test series ends.
7.1. Results of synthetic materials
All four different synthetic materials described previously were tested and classified to the hail resistance classes, as shown in Figure 11.

The test series with thin-wall-sheet elements showed a drastic reduction of hail resistance class overits service life. The new thin-wall sheets were classified in hail resistance class 5. In comparison to these new ones, the aged ones were classified in hail resistance class 3. The is due to aging by UV – radiation and the associated embrittlement.
7.2. Results of float glass
The float glass samples with three thicknesses – 2, 3 and 4 mm - were tested and classified into hail resistance classes, as shown in Figure 12.

Two outliers of the series with a 4 mm thickness were found with the higher hail resistance class 4.
7.3. Results of chemically tempered glass
The chemically tempered glass samples with three different thicknesses – 2, 3 and 4 mm - were tested and assigned to hail resistance classes as shown in Figure 13.

One outlier of the series with a 2 mm thickness with the lower hail resistance class 4 and one outlier of the series with a 3 mm thickness with the lower hail resistance class 3 were detected.
7.4. Failure analysis
An evaluation was carried out of the failure of the test series, after tests were carried out with different materials. Greenhouse films were assigned hail resistance class 3. The location of the failure as a bullet penetration was observed at the impact point in the corner for nearly all specimens, as shown in Figure 14a.). The test series with acrylic glass, which was classified in hail resistance class 3, showed a star-like fracture pattern at the impact point in the centre, as shown in Figure 14b.). The new thin-wall panels withstand the hail resistance class 5. Only small dents, as seen in Figure 15 c.), could be detected. The aged thin-wall sheets could only be classified as class 3 and the failure as bullet penetration was observed, as shown in Figure 14d.). The test series of float glass with hail resistance class 3 showed failure behaviour as bullet penetration, as can be seen in Figure 14d.). In comparison to the float glass the chemically pre-stressed glass could be classified as hail resistance class 5 without breakage.

8. Conclusion
Due to climate change, there will be more extreme weather in the future, such as storms, heavy rain events in combination with hail, and the associated damage in various structural areas of our life such as the envelopes of greenhouses from hail. It is expected that such extreme hail events will also occur in regions where such events have not yet been observed. For this reason, it is important to address issues ranging from the origin of hail to the damage caused by hailstorms.
The so-called hail resistance classes can be determined in the laboratory using suitable testing equipment. This determination of hail resistance classes was carried out in the laboratory of the University of Applied Sciences FH Joanneum Graz. The results of the classification into hail resistance classes were presented for different materials for greenhouse roofing.
The test series showed a lower a lower hail resistance class for synthetic material like greenhouse film, acrylic glass, and thin wall panels when compared with glass as a material for greenhouse coverings. In the case of synthetic materials, aging with the effect of an increase in brittleness must be considered. In the case of glass as a material, such an effect has not yet been.
Acknowledgements
This test series were carried out in the research project “Josef Ressel Centre for Thin Glass Technology for Structural Glass Applications” funded by the Christian Doppler Research Association.
References
Austrian Hail Insurance Agency, www.hagel.at
Wascher, H.: Hagelschauerprüfungen an Gebäudehüllen, Dissertation. Technischen Universität Graz, Fakultät für Bauingenieurwissenschaften, Graz: TU Graz (2013)
IPCC, 2014: Klimaänderung 2014: Synthesebericht. Beitrag der Arbeitsgruppen I, II und III zum Fünften Sachstandsbericht des Zwischenstaatlichen Ausschusses für Klimaänderungen (IPCC) [Hauptautoren, R.K. Pachauri und L.A. Meyer (Hrsg.)]. IPCC, Genf, Schweiz. Deutsche Übersetzung durch Deutsche IPCC-Koordinierungsstelle, Bonn, 2016, S.63.
ZAMG, Zentralanstalt für Meteorologie und Geodynamik, Lebensministerium und VVO - Verband der Versicherungsunternehmen Österreichs (Hrsg.): Weiterführende Information – Hagelschaden. https://hora.gv.at/assets/eHORA/pdf/HORA_Hagelschaden_Weiterfuehrende-Informationen_v1.pdf
VKF, Vereinigung Kantonaler Feuerversicherungen VKF (Hrsg.): Hagelregister (HR). VKF Prüfbestimmungen Nr. 00a Allgemeiner Teil A.


