Authors: Timon Peters, Peter Hof, Miriam Schuster, Jens Schneider & Matthias Seel
Source: Glass Structures & Engineering (2023) 8:353–362
DOI: https://doi.org/10.1007/s40940-023-00232-1
Abstract
EN1288-3 (Glass in building—Determination of the bending strength of glass—Part 3: test with specimen supported at two points (four point bending), 2000) describes the four point bending test for the determination of glass strength. The failure stress is calculated from the vertical force of the testing machine. To determine the difference between the stress calculated from linear 1st order theory and actual glass stress, a factor ke is given. This factor is derived from a 1994 publication (Blank in Glass Sci Technol 67:9–15, 1994) that uses a very simplified finite element model. The present paper will show that for tests with high deformation, which becomes more relevant for smaller glass thickness and chemically strengthened glass, these results differ vastly from the actual behavior of the glass in the four point bending test as it is performed in most industry and lab settings. With the corrected curves for ke, increases in the characteristic edge strength of more than 50% compared to the current version of EN1288-3 can be derived from the four point bending test in some cases.
1 Introduction
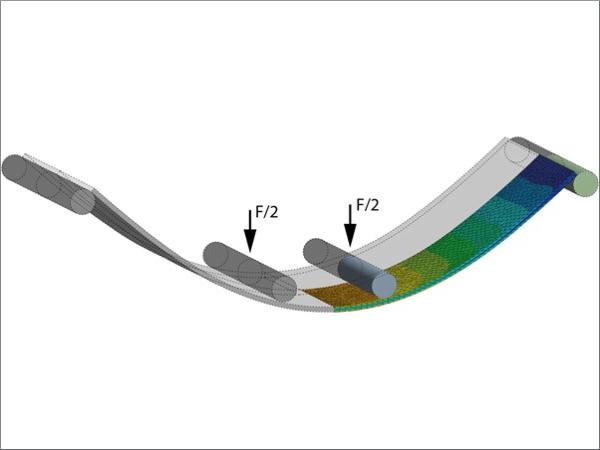
The four point bending test described in EN1288-3 (Fig. 1) consists of a 1100 mm by 360 mm glass plate that is held by two support rollers spaced 1000 mm apart. Two bending rollers spaced 200 mm apart press on the glass from the other side. Between the rollers and the glass, a layer of rubber is used for protection. The force of the machine creates a nearly constant bending moment between the bending rollers that results in a nearly constant edge and surface stress at a total edge length of 400 mm and a total surface of 72,000 mm2. During the test, the stress is increased by 2 ± 0.4 MPa/s by increasing the vertical force on the bending rollers. This is done repeatedly until failure of each individual glass plate to determine the characteristic edge or surface strength of a series of test samples.

The glass stress is calculated from the applied vertical force with a formula given in EN 1288–3. Formula (1) for determination of the edge stress contains a factor ke which marks the difference between the stress calculated from linear 1st order theory and the actual stress in the glass. ke depends on the glass thickness h and the ratio of the vertical displacement of the centre of the glass plate to the glass thickness (y/h). The values are provided via a set of graphs calculated by Blank et al. (Blank et al. 1994) using finite element simulation in a 1994 publication.
Using the factor ke, the glass stress σbB is calculated by:

with the stress from self-weight σbG:

and with the glass width B and the self-weight of the glass ρ × g.
The test setup described by EN1288-3 can be interpreted in different ways leading to different values of ke. The finite element simulation from Blank et al. (Blank et al. 1994) which EN1288-3 is based on models the setup as if the rollers are attached to the glass and have a diameter of zero, which does not represent practically feasible test setups. Therefore the values for ke from this simulation are expected to differ from values obtained from real-world test setups.
This research consists of five parts. The first is recreating the calculations from Blank et al. to show and verify that simplified finite element calculations with the boundary conditions chosen in the 1994 publication lead to curves for ke like the ones given in EN1288-3. The second part is comparing three possible interpretations of the test setup descriptions from EN1288-3. In the third part, a simplified analytical model is used to qualitatively produce curves for the three setups from part two, showing that the differences are significant. The fourth part consists of calculating the curves of ke for the most realistic test setup using a more sophisticated finite element model. Finally, the fifth part contains a verification of the finite element simulation from part four using mechanical testing of a glass sample in a four point bending test.
2 Recreation of finite element simulation from Blank et al. (1994)
The finite element simulation from Blank et al. (Blank et al. 1994) on which the curves in EN1288-3 are based has been recreated in the finite element software ANSYS. The model (Fig. 2) consists of a symmetric quarter of the specimen and is composed of two sections of 36 8-node shell elements (for our simulation SHELL281 elements were chosen in ANSYS Mechanical APDL 18.2). Both the area between the centre of the plate and the bending rollers and the area between bending and support rollers is comprised of six by six elements. The support roller nodes are supported in vertical direction, all other nodes are free to move. The load is applied as a set of point loads to the nodes of the bending rollers. The self-weight is assumed to be distributed evenly across the surface and is applied as surface pressure. For comparability, the mechanical properties (E = 70,000 MPa and µ = 0.22) are chosen to be identical to the ones used in the model by Blank et al., even though EN572-1 gives a different value for the Poisson’s ratio (µ = 0.2) of soda-lime silicate glass (EN572-1:20162016).

The shape of the curves (Fig. 3) calculated from this finite element model using Eqs. (1) and (2) fit the results from Blank et al. and the graph displayed in EN1288-3 quite well. The values for ke are just slightly lower, this may be due to the fact that the exact element formulations, boundary conditions and algorithms used by Blank et al. were not described in detail. However, this simulation shows that the basis for EN1288-3 can be reproduced.

3 Test setup
EN1288-3 gives a schematic description of the test setup for the four point bending test (Fig. 1). This description is a vastly simplified version of the actual testing equipment used in most industrial applications and labs. Therefore, it can be interpreted in different ways resulting in different values for ke from theoretical calculations (Fig. 4).

The first interpretation (called “setup A” from here on) is an exact copy of the simplified schematic. In this setup, the support rollers sit loosely on a flat surface, the glass is placed on top. The bending rollers are also just placed loosely on the glass, and a plate is then pressed down from the top. This setup requires friction between the rollers and the other two surfaces, otherwise the rollers would slide out of the setup horizontally.
The second interpretation (called “setup B” from here on) is a setup where both support and bending rollers are fixed to the testing machine. This is usually done by having fixed bearings at the end of the rollers. In this version, the weight of the bending rollers is usually also supported by the testing machine, which is not the case for setup A.
The third interpretation (called “setup C” from here on) is a setup that has the rollers attached to the glass so that the horizontal spacing of the rollers stays constant relative to the curved glass surface. Actually building this setup would require a fixed connection of the rollers and the glass (e.g. clamping or glueing) which is not convenient in reality. However, this was the setup indirectly chosen by Blank et al. for the simulation since the support conditions fit this setup. Blank et al. also made the simplification of having a roller radius of zero.
For the deformed shape of the glass, these setups result in different lengths of the lever arms with which the vertical force is inducing a bending moment in the glass and the direction of the forces relative to the glass surface (Figs. 5 and 6, Table 1).


Table 1 calculation of the relevant geometry variables - Full size table

For setup A, the support and bending rollers roll horizontally while not slipping relative to all surfaces. Therefore, the curved glass length between the rollers increases slightly, but not as much as with setup B where the rollers are fixed horizontally. In both cases, the force acting on the glass surface is no longer vertical and therefore becomes larger than the vertical force component of the machine. In setup A, the direction of the force is determined by a line going through the two contact points of the roller. In setup B, the force acts perpendicular to the glass surface.
With setup C, since the rollers attached to the glass can roll freely on the surfaces of the machine and hence no horizontal force can be applied via the rollers, the force acting on the lever arm stays vertical and is always equal to the vertical force of the testing machine.
As will be shown in the next sections, this results in setups A and B having an increase in bending moment change with higher vertical load while setup C shows a decrease. Therefore, the curve for ke will be significantly different in the three setups.
4 Simplified calculation for the curves for k e
Using a continuously differentiable approximation of the deformed geometry of the test setup consisting of a circular arc between the bending rollers, a straight piece at the ends and a smooth transition curve (cubic parabola, which is the 1st order theory bending shape of a cantilever with a single load on the end) between the bending and the support rollers (Fig. 6), approximated curves for the factor ke can be calculated. This geometry mainly ignores the normal force generated in the glass and the three-dimensional Poisson effect (Blank et al. 1994; Zaccaria et al. 2022) which causes the edges of the glass to bend outwards under high deformation, which both increase the stress in the glass and therefore ke slightly.
The above deformed geometry problem needs to be solved for all three setups, with the rollers either attached to no surface (setup A), to the supports (which results in horizontal displacement a = 0 and b = 0 for setup B) or to the glass (which results in constant larc, larm and lend for setup C). With a glass thickness, a rubber interlayer thickness and a roller diameter of zero and ignoring the self-weight of the glass, the deformed geometry, load lever arm and force direction for different radii r can be determined (Table 1).
As a result, for different thicknesses h and bending radii r between the bending rollers the Kirchhoff plate theory gives

with E = 70,000 MPa and µ = 0.23 from which F can be derived. With the edge stress

Eqs. (1) and (2) and the geometry from Table 1, y/h and ke can be calculated. The curves for setup A and B end when lend becomes zero, resulting in the glass slipping off the supports.
Due to the simplifications, these curves do not show exact results for the four point bending test. Still, the results (Fig. 7) show significant differences in the curves for ke, with setup C showing an opposite (downward) trend compared to setup A and B, indicating that the difference between the three setups should be considered when testing glass.

5 More exact finite element simulation for setup B
Since our experience shows that setup B is the setup used by almost all industrial and lab testing setups, the curves for ke have been calculated in more detail using finite element simulation, again in the software ANSYS (version 18.2) but this time using state-of-the-art technology like sliding contacts and models with much finer meshes and load steps which were not solvable in reasonable time in 1994 (even with today's computing power, each solution took several minutes to compute) (Fig. 8). The model, which due to symmetry consists of one quarter of the full test setup (with the “overhanging” ends of the plate outside the support rollers, unlike the model in Sect. 2), consists of a stiff support roller fixed in space with a frictionless connection to the glass plate, a glass plate comprised of volume elements with a mix of triangular and quadrilateral surfaces to avoid unwanted element stiffening effects and a stiff bending roller with a frictionless contact surface that is moved vertically in about 50 load steps per curve and which cannot move horizontally. To validate the correctness of the model, convergence analyses for both mesh size and number of load steps have been performed. The rubber interlayer (Fig. 1) has not been modelled since its exact viscoelastic properties and dimensions are not specified in EN1288-3. A thick rubber interlayer would increase ke slightly, hence ignoring it yields a lower glass strength and would therefore be on the safe side.

The resulting curves (Fig. 9) which have been calculated using Eqs. (1) and (2) resemble the curves from Setup B in the simplified calculation. Some differences can however be seen due to added self-weight (lowering ke at the start of the curves) and the influence of the roller diameter and normal forces in the plate (both slightly increasing ke for higher y/h). The stress σbB has been evaluated at the edge of the plate, 100 mm from the centre, below the initial position of the bending rollers, at the point with the lowest edge stress in the testing area (the edge stress increases slightly towards the centre of the plate due to normal forces and the Poisson effect (Blank et al. 1994; Zaccaria et al. 2022), therefore this is on the safe side).

At ke ≈ 1.5, the glass is slipping off the supports. Table 2 gives the calculated limits of the four-point bending test from the simulation:
Table 2 theoretical limits of the four point bending test (glass slipping off the support rollers) - Full size table

Since it is in most cases much easier to measure the vertical displacement of the bending rollers via the machine controls instead of the deflection of the centre of the plate, it may be advised to make the curves in EN1288-3 dependent on yload/h instead of ycentre/h. A good approximation of the relation of yload and ycentre can also be derived from the finite element simulation for setup B and from the simplified calculations for setup A, B and C:
![]()
The curves for yload/h from the finite element simulation for setup B are given in Fig. 10.

6 Experimental validation
To further confirm the results, a four point bending test using setup B has been performed to compare the results for a h = 4 mm specimen. The glass specimen was equipped with two strain gauges along one edge, the first below one of the bending rollers and the second in the centre of the plate for validation. The data from the first strain gauge was used to enable comparability to the finite element analysis. The vertical displacement was measured by the testing machine. The test was performed at 50% size (2 mm thick specimen with Ls = 500 mm, Lb = 100 mm and a roller diameter of 25 mm) because a more precisely controlled test environment was available at our lab for this size. It was then scaled up mathematically afterwards, which is possible since effects like the size effect only come into play when the glass is tested to failure. Although the test result (Fig. 11) is not in perfect accordance with the simulation, the result still shows that the simulation of setup B seems to be more accurate than setup C which EN1288-3 is based on.

7 Conclusion and suggestions
The curves for ke used to determine the edge strength in EN1288-3 (EN1288-3:20002000) are based on the assumption of setup C with a roller diameter of zero, which from our experience does not represent the setup that is used in almost all industrial and lab testing environments. Setup A and B are the only two practically feasible setups, with setup B being the standard nowadays. Therefore, the curves for ke in EN1288-3 which are based on a simplified, non-realistic version of setup C should be changed to the curves for setup B. Alternatively, using a safety factor, e.g. ke = 0.95 for y/h < 3 and ke = 1 for y/h > = 3, would be on the safe side.
With large deformation y and therefore large values of y/h, values of ke can become as high as 1.5 (e.g. 3 mm sample at σ = 245 MPa). This is especially relevant for glass with smaller thickness which is more likely to get close to the limits given in Table 2. Additionally, the advancement of chemical strengthening of glass, which can easily produce glass strengths in excess of 300 MPa (Zaccaria et al. 2022) makes this especially relevant. In practice, this means that with the curves for setup B, much higher glass strengths may be derived from the four point bending test resulting in thinner and more efficient glass elements.
Since EN1288-3 does not only apply to the strength of the glass edge, but also allows to determine the glass surface strength or overall strength, changes should be made here as well. The current version of the code gives a factor k = ks = 1, which requires further investigation. This applies mainly to tempered glass which, from our own experience, is more prone to show surface failure while chemically strengthened glass will more likely break from the edge.
Funding
Open Access funding enabled and organized by Projekt DEAL. No funds, grants, or other support was received.
Author information
Authors and Affiliations
Glass Competence Center at TU Darmstadt, Darmstadt, Germany
Timon Peters, Peter Hof, Miriam Schuster, Jens Schneider & Matthias Seel
Corresponding author
Correspondence to Timon Peters.
Ethics declarations
Conflict of interest
The authors have no competing interests to declare that are relevant to the content of this article.


