Date: 22 October 2018
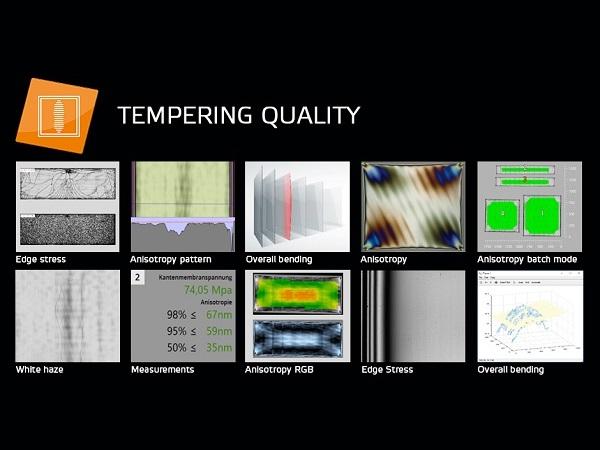
A seamless record of the glass quality is imperative. A lack of useful feedback during the heat-treating process can lead to varying qualities within the final product. The LineScanner provides this feedback by displaying real-time data to the tempering furnace operators. With the help of the LineScanner, companies can now check every heat-treated lite for anisotropic properties – in combination with the thermal imaging – and the edge stresses.
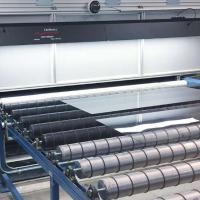
The LineScanner on the tempering furnace checks the following parameters for each glass sheet, in a single scanning process with minimal space requirements:
- Isotropy / anisotropy value [%]
- Edge stress [MPa]
- Glass quality (scratches, inclusions, soiling, coating defects, etc.)
- Edge quality (conchoidal fractures)
- Glass dimensions (drill hole locations, drill hole diameters, corner cut-outs, edge cut-outs, etc.)
- Screen printing quality (pinholes, screen printing position)
- Logo position & logo quality (image-in-image comparison)
- Data matrix interpretation

ANISOTROPIE / ISOTROPIE
With the use of the LineScanner on a tempering furnace, we have created a masterpiece in the field of non-destructive quality controls. Quality checks such as geometry, surface quality, edge quality, DMS tests, anisotropy and edge stress can now also be monitored.
The LineScanner comprehensibly calculates the light delay for each individual pixel (0.015mm²) of a glass sheet, independent of the sheet position and sheet rotation, without a need to calibrate the respective type of glass!
If an irregular stress state is present in terms of the stress direction per pixel, this will lead to a corresponding light delay. This light delay is perceived as a disturbing effect on the sheet with the respective ambient conditions and viewing angle.


At the current time, no standard specifies the limit values or the method for determining the values to be displayed. However, with a LineScanner investment security is guaranteed here, because the following parameters are determined through the unique telecentric configuration coupled with corresponding lighting technology:
- Light delay in nanometres per pixel across the entire sheet
- Measurement range up to 465nm or optionally up to 900nm
- A measured value of up to 465nm is absolutely essential, because straight TVG and “thicker glass units” can exhibit higher values
- Determination of limit values
>> 98% of the area is lower than 80nm
>> 95% of the area is lower than 71nm
>> worst nm value is 93nm
All these results are stored in a database for 100% seamless documentation.

Project // Gläsernes Glas
In cooperation with the RWTH Aachen University - Pietro die Biase and Benjamin Schaf, as well as the Munich University of Applied Sciences - Prof. Ing. Christian Schuler and Steffen Dix, the two industry partners Uniglas GmbH - DI (FH) Thomas Fiedler, and VitroDur GmbH - Uwe Bergmann, the mathematical structures were initially successfully formulated, the requisite technical basis developed, and an initial common project put into successful operation.
MEASUREMENT OF THE EDGE STRESS
For a professional and comprehensive definition of the quality, it is also important to measure the edge stress along all edges of a specific lite. By doing so, the LineScanner determines the edge stress levels and provides a precise result regarding the expected fragmentation pattern. Only this unique and telecentric approach, provided by the Softsolution LineScanner, can offer a solution that includes every combination of quality check possible all within a single quality inspection system.
The LineScanner from SOFTSOLUTION is capable of measuring the edge stress continuously (e.g. every 1.2mm) along each edge of a glass sheet. The median of all values, including the standard deviation, are output on this basis. Tolerance settings are naturally possible in this regard. The calculation is based on proven models with consideration to the isochromatic lines.
Advantages
Through measurement of the edge stress, it is possible to guarantee that EACH individual glass sheet is tested with respect to its degree of pre-stressing. I.e. if TVG is to be produced, the LineScanner also checks that this actually is TVG. This simultaneously also applies to ESG. Starting from the edge stress, it is possible to draw conclusions regarding the surface stress and therefore also the anticipated break pattern.

Example
>> Edge stress 94,4 MPa
>> [2,3] Standard deviation
No separate scanning process is necessary for the edge stress. At one time point and therefore with a single pass through the LineScanner, a sheet is tested for all quality criteria.


 600450


Add new comment