Source: Glass Structures & Engineering
Authors: Timon Peters & Jens Schneider
DOI: https://doi.org/10.1007/s40940-024-00248-1
Abstract
In most float glass productions, quality control systems will remove glass inclusions with diameters above 500 µm, since smaller inclusions are usually not visible to the human eye. Yet, they can still become relevant in glass construction, one example being nickel sulphide which can cause spontaneous fracture of thermally prestressed glass. This research presents statistical data on the prevalence of inclusions in the size range with a diameter between 50 and 500 µm, obtained from thorough scans of commercial float glass, showing that the inclusion size distribution follows an exponential curve. Also, many of the found inclusions are investigated by ultra-high-resolution optical microscopy down to resolutions close to the wavelength of visible light, the physical limit of such inspection, while still in the intact glass. Images taken under different lighting conditions and with different types of microscope cameras help in the identification and differentiation of inclusion types. Photoelastic stress measurements and laser interferometry also non-destructively show mechanical stress and deformation inside the glass around inclusions. Due to the risks emerging from this inclusion type, a special focus of the presented work is on the identification of nickel sulphide and its precursors which can be identified by its characteristic surface structure and colour as well as its shape.
1 Introduction
In the glass industry, inclusions are always present in the finished product. Different product qualities are just characterized by the amount, size and types of contaminants. For many standard architectural glasses, only inclusions with a diameter larger than about 500 µm (varying slightly for different manufacturers and products) are discarded during manufacturing because smaller defects are usually not visible to the human eye under normal conditions. Several guidelines like the German “Guideline to Assess the Visual Quality of Glass in Buildings” (Flachglas 2019) are commonly used to determine acceptable glass inclusion sizes based purely on visual appearance.
While most of the common glass inclusions like bubbles and many types of stones are mostly a nuisance affecting the visual quality, others can actually significantly affect the safety of the glass product, even below the limits for visual disturbance. One example is nickel sulphide, an inclusion that shows a delayed crystal expansion that can cause spontaneous fracture of thermally prestressed glass (Kasper 2019a, b; Kasper et al. 2019; Kasper and Rubbert 2020). Currently, the risks from NiS inclusions in tempered glass are being mitigated by the heat soak test (e.g. according to EN14179-1 (2016)), a highly time- and energy-consuming process that would preferably be replaced by more economical and ecological processes. Therefore, this research targets the appearance and prevalence of inclusions with a diameter in the range from 50 to 500 µm, focussing especially on nickel sulphide and other spherical inclusion types that may be hard to distinguish. The overall aim of this as well as further research on glass inclusions and especially NiS is to aid in creating technology and algorithms for replacing the heat soak test for tempered glass with non-destructive industrial scale optical detection methods.
For the analysis of small objects like glass inclusions, there are a lot of possible technologies available, from electron microscopy to X-ray spectroscopy and standard wet chemical analysis. The most common and most accessible method for characterising inclusions however is optical microscopy. Unlike any other analysis methods, the entry hurdle for this technology is very low. Simple yet very capable portable digital microscopes are today often cheaper than an hour of work from an engineer. At the same time, microscope technology is very scalable with expensive high-resolution microscopes being able to show objects at resolutions near the wavelength of the illumination light and therefore near the physical limit of visual inspection. Also, optical microscopy usually allows to inspect glass without the need of breaking it. Some of the many ways in which optical microscopy can help in identifying and characterizing glass inclusions are presented in this research.
2 Inclusions
In our recent research, we were looking for glass inclusions of “compact” type that are located below the glass surface. This includes everything that does not dissolve/decompose fast enough or sink to the bottom/float to the top of the glass melt. It does not include strongly diffused material or minor (re-)crystallisation of main glass ingredients like SiO2. An example of the many different types of inclusions found in an average glass sample are shown in Fig. 1.
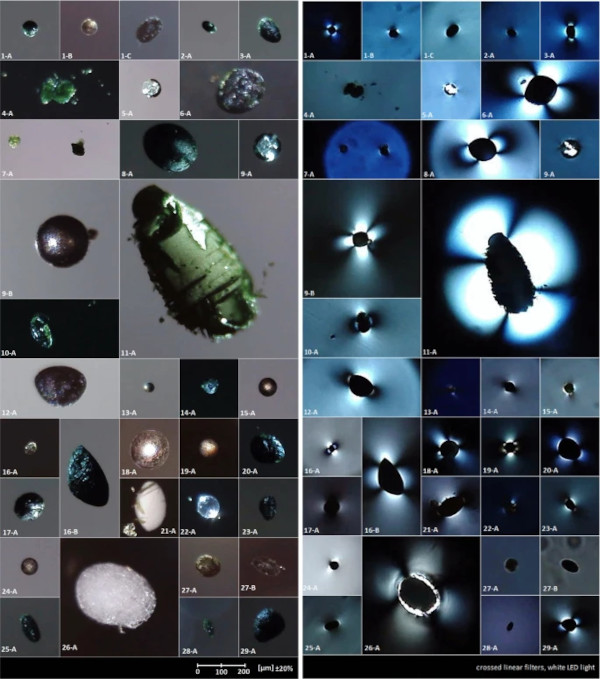
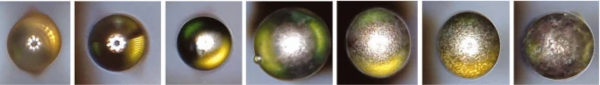
The most common inclusions are bubbles (either clear or filled with refracting and reflecting colourless matter, possibly crystallized salts) and stones (matter that did not melt in the float oven, originating either from contamination of the raw materials or from the slowly dissolving fireproof oven walls). In addition, we can find spheres of material that had been liquid in the glass melt and solidified upon cooling, the most prominent being silicon as well as nickel sulphide and its precursors (these will be examined in detail later).
Since bubbles inside the glass do not show any significant stress around them, and since their surface is usually smooth which reduces the risk of crack formation, they (for most applications) do typically not significantly affect the safety of glass products.
Stones show varying levels of stress depending on their thermal expansion and, in some cases, also their crystalline phase change during cooling (Buchmayer and Buchmayer 1989). High stress around stones usually only becomes a problem when glass is thermally prestressed since most glass failures start from surface cracks. In our experiments, several glass panes containing stones broke during the prestressing process, this phenomenon is also well known in industry. From experience, glass failures due to stones during use of the final product seem to be extremely rare, although no reliable data could be found.
The most critical types of inclusions seem to be the molten spheres of material. Especially silicon is known to create high stress and often large cracks upon cooling (Stachel 2012; Buchmayer and Buchmayer 1989), while nickel sulphide is feared in the glass industry for its delayed phase change resulting in significant volume expansion after several months or years of use, causing spontaneous glass fracture in thermally prestressed glass due to crack formation (Kasper 2019a; Kasper and Rubbert 2020; Stachel 2012; Buchmayer and Buchmayer 1989).
2.1 Size distribution
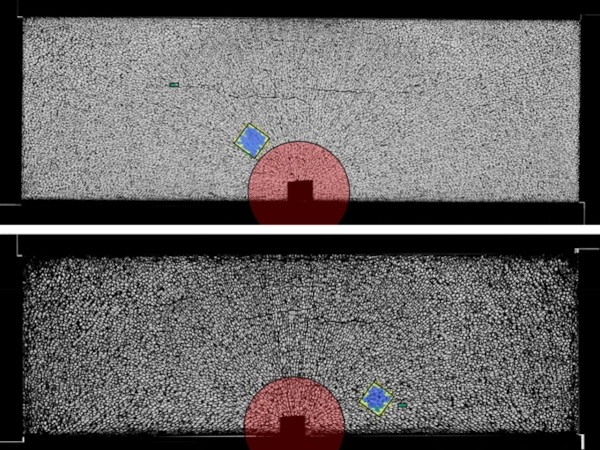
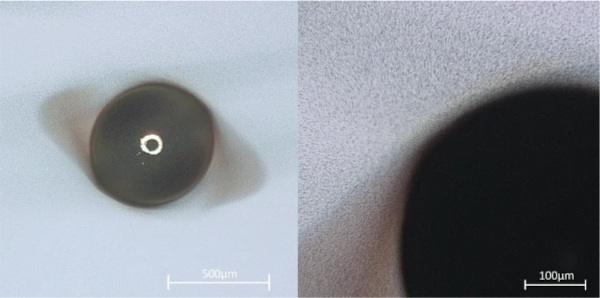
Since inclusions above a diameter of 500 µm are usually detected by automated optical quality control instruments and, together with some surrounding glass, discarded during production of standard float glass, and since inclusions like nickel sulphide only become critical at sizes larger than about 50 µm (Schneider and Hilcken 2010), our research focused on obtaining statistical data for the size distribution of inclusions in this range. The results are given in Figs. 2 and 3.
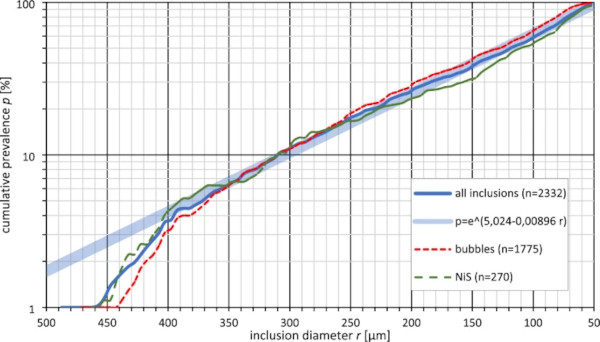
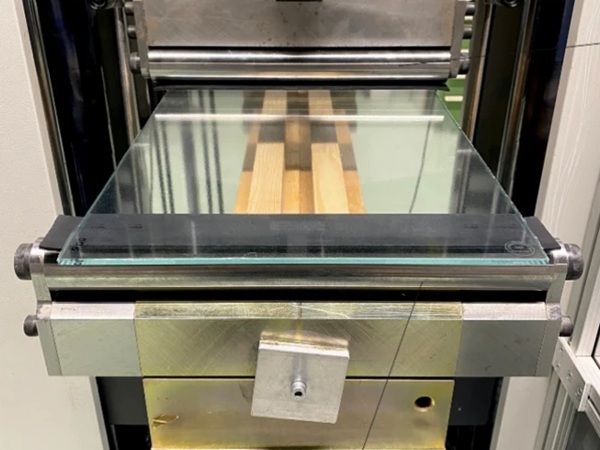
To obtain this statistical data, about 23 tons of commercial soda-lime float glass from two manufacturers were scanned with the prototype of an industry float glass inspection system using high-resolution cameras. Since the inspection system is proprietary technology, it will not be described in detail in this publication. After the detection of the location of possible glass inclusions by the inspection system, the inclusions were inspected via microscopy to verify the finding and to characterize the inclusions according to the criteria shown later in this publication, resulting in the detection of almost exactly one inclusion in the searched-for diameter range per 10 kg of glass (one per 9.87 kg). The actual number of inclusions varies a lot among different products and manufacturers (up to several orders of magnitude).
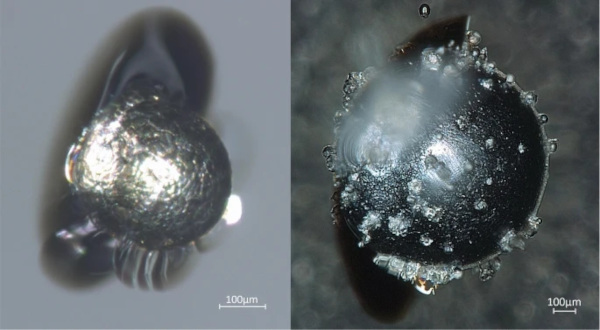
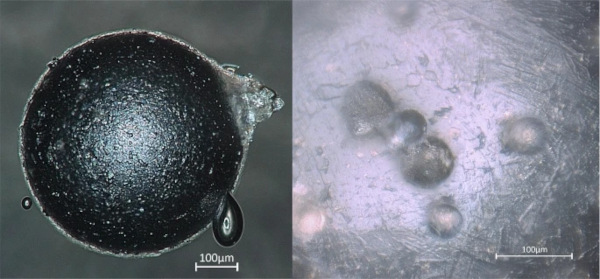
However, data on the prevalence of glass inclusions is generally hard to find in publicly available sources, mostly since this data is often treated as proprietary (e.g. (Molnár and Bojtár 2013)). Still, the size distribution always seems to be similar. From the data shown in Fig. 2, we can clearly see that with smaller size, the number of inclusions increases dramatically. About half of all found inclusions were smaller than 120µm, and only one quarter were in the range of 200 µm to 500 µm. The data also indicates that this size distribution is similar for most types of inclusions, two examples (bubbles and NiS) are shown in the plot. If this data is extrapolated for sizes smaller than 50 µm, one can assume that a large amount of such glass inclusions exists. While detecting and characterizing such small objects is quite challenging, several phenomena found around larger inclusions indicate that this assumption is true. For example, in Fig. 6, a high-resolution photo of a bubble that has collected several particles smaller than 50 µm from the surrounding glass on its surface is shown. In Figs. 1, 7, 8, 9 and 10, several inclusions have small bubbles or particles floating around them, probably as a result of slow decomposition.
2.2 Shape
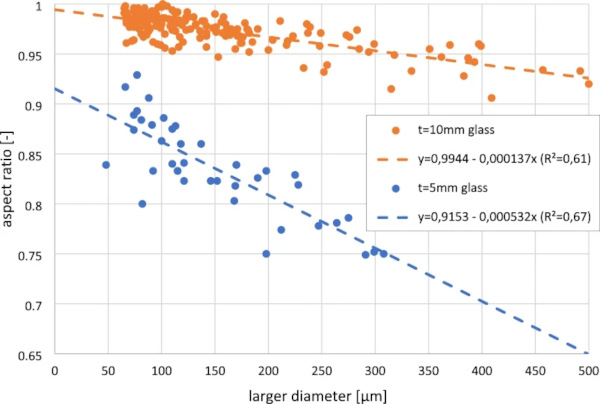
The shape of glass inclusions seems to correlate with the melting temperature of the inclusions. Some inclusions, like many types of stones, do not melt in the glass furnace, even at the 1500 °C to 1600 °C at the beginning of the production process (Glass for Europe 2022), and thereby keep their original shape, often just being slightly rounded or broken into pieces due to dissolution in the glass melt. Many other inclusions melt and form a round sphere due to surface tension. Silicon, which solidifies at around 1400 °C, long before the molten glass is stretched out on the tin bath in common float glass process, is usually found in float glass in perfectly round spheres, independent of the glass thickness. Other inclusions like NiS however solidify below 1000 °C (Waldner and Pelton 2004) during the shaping process of flat glass panes, therefore the shape usually becomes more elongated the more the glass is being drawn during cooling. Due to the ratio of volume and surface, the surface tension keeps smaller inclusions more round while big inclusions sometimes get very elongated (Fig. 3). In another research project, we found aspect ratios (width/length) as little as 0.223, for example for a NiS inclusion with a length of 691 µm found in 2 mm glass.
3 Optical microscopy for glass inclusions
As mentioned in the introduction, optical microscopy is often the preferred method for the identification of glass inclusions. In most circumstances, simple visualization of shapes and colours is the main goal, but with glass inclusions several other useful techniques are possible.
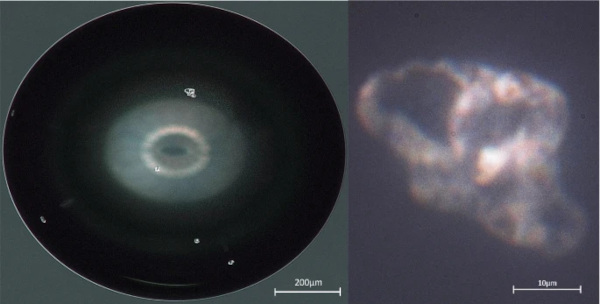
The physical limits of microscopy are usually determined by the wavelength of the illumination (due to effects like interference, diffraction and optical aberration). For the high-resolution optical microscope (Keyence VHX-600D with VH-Z500R lens) used for Figs. 5, 6, 7, 8, 10, and 11, this means that display details with resolutions of about a quarter of a micrometre were visible under white light. Using monochromatic and/or short-wavelength blue/violet light, the limit can be reduced slightly at the cost of full-spectrum colour vision. While this is nowhere near the resolution of electron microscopy (accelerated electrons have wavelengths several orders of magnitude smaller than visible light), it still allows for some interesting analysis methods, some even benefiting from the larger wavelength of visible light. The probably most popular of these methods is the analysis of photoelastic effects in the surrounding glass, a technique well-described in literature (Aben 1993) and known for more than two centuries (Brewster 1815) where the phase velocity of light changes with variations in stress (and material properties), resulting in a change of the polarization angle of light highlighting small deformation of the glass (see Fig. 1).
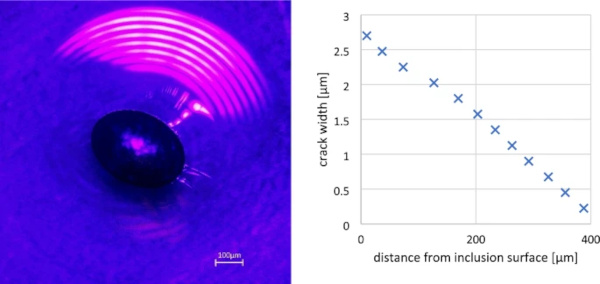
Another application of optical microscopy that makes use of the specific wavelengths of visible light is the measurement of glass crack widths using interference, since the crack width is often in a similar order of magnitude as the wavelength of visible light. By reflecting a directed light source (for example a laser) coupled in the viewing axis of the microscope on the two surfaces of a crack, the resulting interference can easily be used to determine the shape of cracks around inclusions (see Fig. 4), allowing—along with photoelastic stress measurements—for an estimation of the volume change of the object.
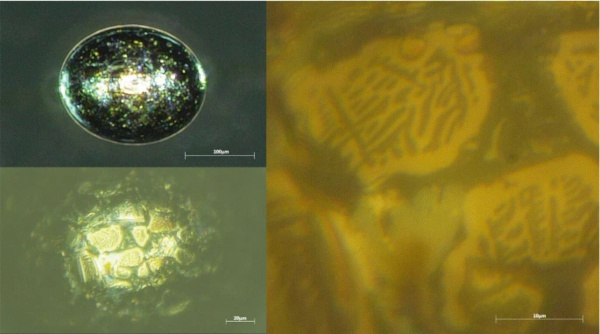
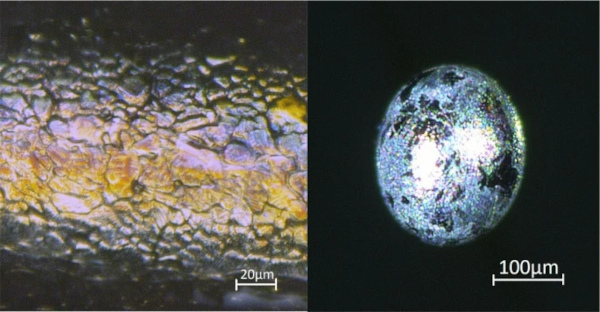
At high magnification, analysis of the surface structure also allows for basic crystallographic analysis of many inclusion types where crystallites are large enough that lattice types and crystal angles become visible (Fig. 5).
Other technologies such as automatic 3D scanning by variation of the focus point while taking a series of images are sometimes built into expensive microscopes, but can also easily be done manually.
4 The main types of spherical inclusions
In our research, a big focus is on finding criteria for the identification of nickel sulphide in quality control systems using automated optical microscopy. Since NiS forms from a liquid, its shape is always spherical. Therefore, it is important to know how to differentiate the different types of spherical inclusions, the most common being bubbles, silicon, spherical stones as well as nickel sulphide and its precursors. Iron inclusions have not been found in our research.
Spherical stones can almost always be identified upon closer inspection because their contour turns out not to be a perfect ellipse. The surface also often shows dents or other defects which can easily be made visible by low-angle light (see examples 1-A, 17-A and 27-A in Fig. 1).
4.1 Bubbles
Bubbles are easily identified by shining light through them. If seen from top, they usually show a perfectly flat reflective surface, although sometimes dirt that has accumulated on the surface can be deceptive (see Fig. 6). Sometimes they are also filled with crystallized matter on the inside (see 5-A and 9-A in Fig. 1).
4.2 Silicon
The inclusion type that (besides some very rare types) is in many cases hardest to differentiate from nickel sulphide is silicon. The surface usually shows a similar roughness as some forms of nickel sulphide at low magnification. Also, cracks in the surrounding glass can form that resemble cracks around NiS inclusions.
However, at high magnification, one can usually see that no visible crystallites resembling the ones found on the surface of NiS have formed.
4.3 Iron or nickel
Iron inclusions are often described in literature (Stachel 2012) (Buchmayer and Buchmayer 1989), and their identification seems to be quite simple: they are magnetic, often have bubbles around them, show a characteristic diffusion zone and have a rather smooth surface. For quite a long period of our research, we were convinced that the many inclusions we found that matched this description were indeed iron. However, having a large collection of different glass inclusions, and using information on the phase transition and crystal formation of nickel sulphide from literature (Yousfi et al. 2010), we were able to create a timeline for the formation of nickel sulphide from nickel metal alloys (see Fig. 9).
The inclusion starts as nickel metal and with increasing sulphur content (after Ni metal, it would form Ni3S2 upon cooling (Waldner and Pelton 2004)) slowly turns into nickel sulphide (NiS) in the glass melt. The diffusion zone (see Fig. 10) was not possible to be analysed with our methods, but it can be assumed that some type of “cleaning” process takes place where elements like iron are “washed out” if the inclusion originates from e.g. stainless steel particles (Kasper 2019a), another reason why these inclusions might have been wrongfully identified as iron.
The hypothesis that most of the inclusions identified as iron are actually mainly nickel metal is also supported by the fact that some scientists have not been able to reproduce the formation of iron inclusions because of the fast decomposition in molten glass (Stachel 2012).
4.4 NiS
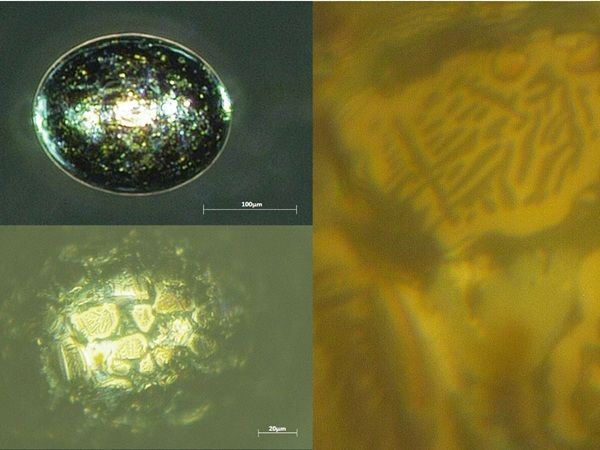
“Mature” nickel sulphide inclusions (those with a composition of Ni1Sx with x in the range of approximately 0.94–1.06) are seen as the main suspects to cause spontaneous fracture of thermally prestressed glass at ambient temperature (Kasper and Rubbert 2020). Due to the characteristic surface structure composed of more or less big crystallites (see Figs. 5 and 11), they are easily identified using high-resolution microscopes. But even with simple equipment, some unique features are often visible. First, many of the inclusions (not all) show a gold-purple colour (see Fig. 11). Also, they are usually of less dark colour than silicon and most stones. In some rare cases though, especially if they have contracted more than the glass during cooling leading to the formation of a cavity, this cavity can accumulate white matter (Fig. 5), sometimes even covering the whole inclusion, giving it the appearance of quartz or bubbles filled with salt at first glance (Fig. 11).
5 Conclusion
This work shows which inclusions and inclusion sizes are to be expected and how (high resolution) optical microscopy can aid in the identification and characterisation of glass inclusions, especially critical nickel sulphide and its precursors (indicating a potential future nickel sulphide problem for the manufacturer). This may aid in creating industrial optical non-destructive detection systems for replacing the heat soak test, a contribution to more sustainable glass production.
However, since during our research several unexpected findings have been made, like the existance of NiS inclusions completely covered in white crystalized matter, optical microscopy can always only be one part of the identification of inclusions. Further investigation like XRD analysis may be required in some cases.
From the high number of inclusions that are not visible under normal circumstances and the increasing prevalence for smaller diameters, it can be determined that discarding all glass with inclusions is only reasonable if very clean glass is required for special applications (e.g. optical instruments or screens), otherwise significant ecological and economical impacts might arise. Certain inclusions like NiS pose a risk to the structural performance and safety of the glass, these need to be identified so that the glass containing them can either be discarded or only be used in applications where the inclusions do not pose a safety risk. Shape, surface structure, colour, brightness, visible crystallisation as well as stress and diffusion zones in the surrounding glass, all determined from non-destructive optical microscopy, can help in selecting these inclusions.


")