Source: Glass Structures & Engineering
Authors: Jagoda Cupać, Kyriaki Corinna Datsiou & Christian Louter
DOI: https://doi.org/10.1007/s40940-024-00267-y
Abstract
Glass is a highly durable and infinitely recyclable material, yet in practice only a small portion of architectural glass products re-enters the value chain after its first use. An increasing rate of energy retrofits of the EU building stock will result in replacement of 85% of existing windows in near future; in the current linear glass supply chain, this will generate large amounts of glass waste. Despite high recycling rates of container glass in Europe, window glazing is very rarely recycled into new glazing, and reuse is almost entirely unexplored. For aged glazing to be reused in construction, better knowledge of its surface quality and structural performance is needed.
The main objective of this paper is to explore the effects of ageing and exposure to indoor and outdoor environment on the strength of glass. A comparative investigation is undertaken to evaluate the strength and surface quality of the internally, externally and cavity-facing glass surfaces of insulating glass units (IGUs) after 30 years of use in a building envelope in the Netherlands. The glass panes are separated from the IGU assembly and cut into specimens for microscopy and coaxial double ring tests. The study shows that the visual quality is best preserved on the cavity-facing surface, consequently exhibiting the highest bending strength. The internally and externally facing surfaces, with visibly more extensive damage, exhibited similarly lower strengths at low probabilities of failure. When compared to the design strength of new annealed glass acc. to EN 16612, all the surfaces showed a reuse potential, with considerable bending strength.
1 Introduction
Glass is a highly durable and infinitely recyclable material, yet in practice only a small portion of architectural glass products re-enters the value chain after its first use. In view of the European Green Deal and the 2050 decarbonisation objectives (European Commission 2020), 85% of the existing window stock, with the average insulation performance of only Uw = 3.4 W/(m2K), will require refurbishment or replacement (European Commission 2018). In the current linear glass supply chain, this will generate large amounts of glass waste. Despite high recycling rates of container glass in Europe, flat glass used for window glazing is very rarely recycled into new glazing, and reuse is almost entirely unexplored.
For instance, a study on recycling of flat glass in Germany showed that almost 90% of flat glass waste generated in the building sector is recycled (Rose et al. 2019). However, only 11% is returned to the flat glass production, while the remaining glass recyclate (cullet) is downcycled into container glass, mineral wool, glass beads and glass flour. Hartwell et al. (2023) identified similar trends mapping the UK flat glass value chain, where end-of-life building glass returns to the container glass market, or, in case of lower quality cullet, to the aggregates market or glass beads. In Sweden, which has well-developed closed-loop supply chains for many materials, only 1% of flat glass is processed in a closed loop (Forslund and Björklund 2022), while in the Netherlands a higher percentage of 7.5% is achieved, resulting from the establishment of the nationwide glass collection initiative “Vlakglas Recycling Nederland” (Bristogianni and Oikonomopoulou 2023).
Focusing more specifically on insulating glass units (IGUs), Geboes et al. (2023) analysed the level of application of circular practices in the Belgian regions of Flanders and Brussels, including recycling, reuse, repair and repurpose. Even the pre-consumer IGUs, originating from order surpluses or damage during installation or transport, are typically downcycled to container glass, glass wool insulation or foam glass, due to possible contamination of the glass with nickel sulphide from the metal spacer bars. Such contamination, once introduced into the float line furnace, can take several days of lost production before passing through the system. When left undetected, it can cause spontaneous glass breakage after manufacturing and thermal tempering. Most of the post-consumer flat glass waste from IGUs is used in low value applications, i.e. as filler in recycled aggregates for concrete production. The study mentions an instance of IGU glazing repurposed as indoor partitioning wall, but states that repair and reuse, and even closed loop recycling, are still absent in the Flemish and Brussels construction practices.
IGU repair remains a niche market, demonstrated only through a couple of projects, such as Empire State Building in New York and One Triton Square in London (ibid.). In 2021, Dutch company GSF Glasgroep launched a circular IGU made of one uncoated glass pane obtained from disassembly of end-of-life IGUs, and one virgin coated glass (van Nieuwenhuijzen et al. 2023). Today, the company also offers a fully circular IGU made from two reused and uncoated glass panes, with a maximum U value of 2.7 W/(m2K). The maximum U value of the former, 50% circular IGU, is 1.1 W/(m2K) (GSF Glasgroep 2024). A recent built example of glass reuse is the Natural Pavilion designed by the architectural firm DP6 architectuurstudio for the Floriade Expo 2022 in Almere, the Netherlands. The project reused single glazing from a government building in the Hague, adapting the design of the building to the size of the reclaimed glass panels (DP6 architectuurstudio 2022; Veer et al. 2023).
IGUs are mainly being replaced due to degradation of the primary seal which results in significant reduction of thermal performance and may lead to condensation in the air cavity, with a negative impact on the transparency of the glazing (Fig. 1). The expected service life of an IGU assembly is only 25 years, due to the limited durability of the seal, while the expected service life of a single glass pane is 60 + years (CWCT 2021).

For aged glazing to be reused in construction, better knowledge of its surface quality and structural performance is needed. The strength of (new) glass is governed by the condition of its surface, i.e. the density and depth of flaws which arise during the manufacturing process, and subsequent processing, handling and installation. Additional damage accumulates from exposure to wind-borne debris, human impact or cleaning during the service life, resulting in reduced strength of aged glass. The reduction of glass strength due to ageing has been investigated in a limited number of studies. Overend and Louter (2015) analysed naturally weathered annealed glass after 20 years of service life as single glazed windows in a low rise building in Norfolk, UK. The glass was tested in a coaxial double ring (CDR) setup, with the loading ring diameter DL = 15 mm, and the supporting ring diameter DS = 48 mm, following the ASTM recommendations (ASTM C1499-09 2013). The tests were performed under inert conditions, at a stress rate of approximately 2.3 MPa/s. The mean strength of the aged glass amounted to σf,0.5 = 101.2 MPa or 70% of the strength of new glass, tested in the same study.
However, at lower probabilities of failure, which correspond with the design value commonly used in engineering applications, the strength level of aged glass reached only 24% of the strength of new glass (σf,0.008 = 18.7 MPa). In a subsequent study of artificial ageing methods for glass, Datsiou and Overend (2017a) performed additional destructive tests on the aged glass sourced from the same building. The CDR tests were performed on larger specimens (DL = 51 mm; DS = 127 mm) under ambient conditions, with increased stress rate of 20 MPa/s to minimise the influence of sub-critical crack growth. The study showed that the glass suffered 73–85% strength reduction at lower probabilities of failure (σf,0.008 = 10.0–18.4 MPa), with respect to new glass tested under the same conditions. In 2023, 50+-year-old monolithic annealed glass, originating from the renovation of a high-rise office building in the Hague, was tested by Veer et al. (2023). The glass was installed in the outer skin of a double skin façade, exposed to relatively high wind loads and abrasion due to the proximity to the sea and major roads and the height of the building.
Two sample sizes were tested in CDR setup to examine the size effect, with (i) DL = 72 mm; DS = 150 mm, and (ii) DL = 180 mm; DS = 250 mm, selected in accordance with the ASTM C1499-09 (2013). The specimens were covered with a self-adhesive plastic foil on both sides, to contain the fragments after fracture and limit the effects of stress corrosion. The tests were conducted at a nominal stress rate of 7.6 MPa/s and 4.2 MPa/s, for the small and large specimens, respectively. Both exterior and interior surfaces of the aged specimens were tested, as well as new glass, on both air and tin side. The study found an approximately 50% reduction in the mean strength of the weathered glass, compared to new glass, and a minimum strength of about 30 MPa at a probability of failure of 2–5%. No significant size effect was observed for the exterior surface strength, suggesting that the density of the surface damage is so high and uniformly distributed that the probability of detecting a critical defect does not significantly depend on the size of the tested surface. However, for the interior surface, the tests on larger specimens resulted in significantly lower strength, relative to the smaller specimens, indicating a lower density of more singular defects.
In 2023, Rota et al. (2023) published a study proposing a quality protocol for the reuse of end-of-life window glazing, including the assessment of the surface quality of 43 IGUs collected in residential buildings in Belgium after 28–41 years of service life. The IGUs were disassembled, and the glass tested in a CDR setup according to the ASTM C1499-09 (2013). Several specimen sizes were investigated, including different DL/DS combinations (20 mm/80 mm, 40 mm/80 mm and 80 mm/150 mm), with a constant nominal stress rate of 2 MPa/s. The study focused on the strength on annealed uncoated glass, with an additional series of thermally tempered glass (tempered after ageing). The surface quality was pre-assessed with a commercially available optical scanner, fitted on a manufacturing IGU line, and sorted into quality levels—QL1, QL2, QL3—according to the number of detected spot and linear defects. The strength data was analysed with respect to the predetermined quality level and the tested IGU surface (Fig. 2, surfaces S1–S4).
The glass classified as Q1 exhibited a strength value comparable to new glass, with the expected decrease in strength observed for the lower quality glass. The comparison of the characteristic bending strength (at a 5% probability of failure) of different IGU surfaces led to a surprising outcome—the cavity facing surfaces S2 and S3 resulted in the lowest strength (σf,0.05,S2 = 45 MPa; σf,0.05,S3 = 44 MPa), followed by the externally and internally facing surfaces S1 and S4 (σf,0.05,S1 = 48 MPa; σf,0.05,S4 = 54 MPa). No correlation was found between the lifespan of the IGUs and its mechanical performance. With respect to the specimen size and the loading ring/supporting ring combinations, the 80 mm/150 mm combination yielded the highest number of valid tests (fracture origin located within or directly under the loading ring). The results obtained for the tempered aged glass, compared to the tempered new glass, suggest that thermal tempering could be used to improve the strength of aged post-consumer glass.

In the most recent study by Stuurstraat (2023), 36-year-old IGUs from an apartment building in Amstelveen, the Netherlands, were destructively tested in a CDR setup (DL = 60 mm; DS = 120 mm). A total of 406 specimens of uncoated annealed glass were tested under ambient conditions at a stress rate of 20 MPa/s. Analysis of the strength data at low probabilities of failure of 0.8% resulted in the highest strength for the externally facing surface (σf,0.008,S1 = 24.1 MPa), followed by the internally facing surface (σf,0.008,S4 = 16.8 MPa), and the lowest strength for the cavity facing surfaces (σf,0.008,S2 = 11.4 MPa; σf,0.008,S3 = 14.9 MPa).
Existing studies demonstrate that aged glass exhibits reduced bending strength when compared to new glass, however, depending on the application, it still presents a significant potential for reuse. The observed strengths vary greatly, as well as the testing methodologies, making direct comparison and derivation of design strengths difficult. A larger database of strength test results, examining a wider variety of samples, with different origin and level of exposure, is necessary to eventually arrive at a uniform approach to testing and data processing for aged glass, and finally obtain design values which would facilitate its reuse.
The main objective of this paper is to further explore the effects of ageing and exposure to indoor and outdoor environment on the strength of glass. A comparative investigation is undertaken to evaluate the strength and surface quality of the internally, externally, and cavity-facing glass surfaces of insulating glass units after 30 years of use in a building envelope in the Netherlands. The following section describes the evaluation methodology, including the IGU disassembly and cutting, microscopy, strength characterisation and statistical analysis of strength data. The results are discussed in Sect. 3, with the conclusions of the study outlined in Sect. 4.
2 Evaluation of used glazing unit
The IGUs investigated in this study were retrieved from a refurbishment project in Vleuten, a neighbourhood in the city of Utrecht, the Netherlands, in 2016. They had been installed in one-storey high single dwellings. The IGUs have a relatively small dimension of 252 mm × 725 mm. They had been used in transom windows (fanlight), typically installed above openable windows or doors to provide additional light.
Seven IGUs were initially analysed with Bohle GlassBuddy®, to determine the glass thickness, configuration of panes, any coatings, interlayers (i.e. laminated glass), and their exact position in the IGU. The configuration of the IGUs, schematically shown in Fig. 2, includes two annealed float glass panes, with a nominal thickness of 4 mm and 5 mm. According to the refurbishment contractor, the IGUs were installed with the thicker 5 mm pane facing the exterior. No coatings were detected on any of the glass surfaces. The two panes were separated with a spacer and bonded with a sealant, enclosing a 12 mm wide air cavity. Furthermore, the measuring device Bohle TinCheck® was used to identify the tin bath side of the glass. No consistency was found in the placement of the tin/air side relative to the position of the glass surface within the IGU. Glass surfaces are numbered from the exterior to the interior, as shown in Fig. 2 (surfaces S1–S4).
According to the product name, Thermobel®Glaverbel, and the five-digit code imprinted on the spacer (Fig. 3), the IGUs had been produced by AGC Kempenglas in Belgium between January and May 1986. The IGUs had, therefore, been in use for about 30 years. An example of the spacer code is shown in Fig. 3b. The first digit (5) indicates the factory, the second and third (86)—the year, and the fourth and fifth digits (04)—the month of production. The interpretation of the code was obtained through personal communication with the manufacturer.

2.1 IGU disassembly and cutting
To perform the experimental investigation on different surfaces of the IGUs, the units were disassembled, and the glass panes cut into test specimens for subsequent microscopy evaluation and coaxial double ring tests. The units were disassembled by, firstly, removing the secondary seal with a joint knife to provide access to the primary seal (Fig. 4a). With a box cutter, the glass panes and the spacer were then separated by cutting through the primary seal (Fig. 4b). The glass panes were cleaned with a cleaning agent (REINEX GLAS Reiniger) and a dry cloth and handled carefully to prevent additional damage.

After the disassembly, the glass panes were cut into specimens of 100 mm × 100 mm, according to the EN 1288-5 standard for coaxial double ring tests on flat specimens with small test surface areas (CEN 2000). The standard specifies a method for determining the comparative bending strength of glass, as intended in this study, using relatively small specimens, which maximises the number of specimens obtained from a single pane and results in a larger data set for the statistical analysis. The surface of the glass pane was marked for cutting, discarding the edges of the pane, which were likely damaged while cutting through the primary seal (Fig. 5). The glass was manually scored along the cutting lines with a diamond cutter and cut by applying tensile stress along the scored lines. Series of maximum 14 specimens were obtained from each glass pane, reduced in some cases to 12–13, due to the damage which occurred in the disassembly and/or cutting process. The thickness of each specimen was measured at 4 points on the edges, and the average thickness was determined per specimen. The number of obtained specimens tested in each series, and their average thickness, is listed in Table 2.

2.2 Microscopy
Micrographs of each glass surface were recorded for all the specimens to obtain qualitative images of the surface, determine the comparative level of surface damage and detect potential critical flaws (Fig. 6a). Only the central area of 20 mm × 20 mm (enclosing the test area under the loading ring) was examined (Fig. 6c) with an automated digital microscope Zeiss Smart Zoom 5 at a magnification level of 100x. It should be noted that the micrographs provide only a two-dimensional image of the glass surface, without the information on the depth of the detected flaws.

2.3 Strength characterisation
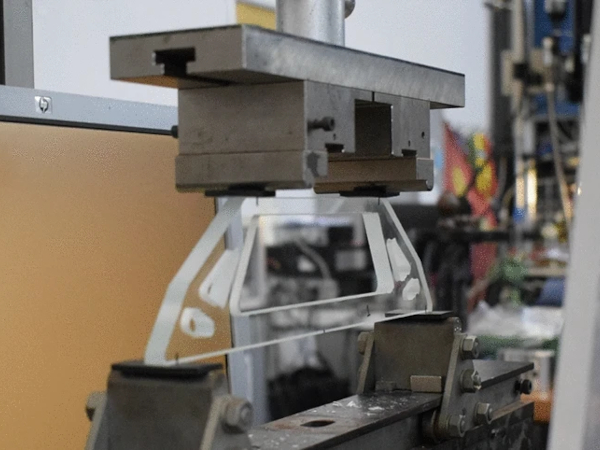
The specimens were subjected to coaxial double ring tests (Fig. 6b), following the procedure set in EN 1288-5 (CEN 2000). The tested IGU surface (Fig. 2) for each series/glass pane (S1/S2 for the external pane, S3/S4 for the internal pane) varied according to the test matrix shown in Table 1. The test series are detailed in Table 2, listing the tested surface, detected tin or air side, average thickness, number of tested specimens and valid tests, and applied nominal stress rate.
Table 1 Test matrix - Full size table
Table 2 Test series - Full size table
For the specimen size of 100 mm × 100 mm, a corresponding loading device R45 was applied, with the radius of the loading ring r1 = 9 mm, and the radius of the supporting ring r2 = 45 mm (Fig. 6c). The tests were performed under ambient conditions (22 ± 2 °C, 36–58% RH), and were force controlled, loading the specimens to failure at a nominal stress rate of 2 MPa/s (except for one series, where a higher stress rate of 20 MPa/s was applied). The corresponding load rate was adjusted for each series, according to the average thickness of the specimens.
An adhesive film was applied on the upper surface of the specimen, facing the loading ring, to retain the fragments after fracture and facilitate identification of the fracture origin. Only strength data from specimens with fracture origins located within or directly under the loading ring were considered valid and were subsequently statistically analysed. Among these, approximately 25% of the valid tests failed directly under the loading ring. Although deviations from the expected equi-biaxial stress state are known to occur at the interface with the loading ring due to contact effects, these become significant as non-linear effects (deflection / thickness ratio) increase, making them more relevant for thin toughened glass (Datsiou and Overend 2017b). Consequently, contact effects were not considered in this study.
2.4 Statistical analysis of strength data
Initially, the fracture strength data, σf, were converted to a time-equivalent strength, σf,eq, to address the varying occurrence of sub-critical crack growth as specimens failed at different times to failure, tf. Specifically, the ramp stress history during the coaxial double ring tests was converted to a constant stress for an equivalent time period of teq = 60s, following Brown’s integral as follows (Brown 1969):

where n = 16 is the static fatigue constant for normal environmental conditions, that is commonly used in glass strength analysis (Haldimann 2006).
The time-equivalent fracture strength data were subsequently statistically analysed and fitted to a 2-parameter Weibull distribution Eq. (2). For this, a weighted least squares regression method was employed in conjunction with Faucher and Tyson’s weight function and Hazen’s probability estimator, following the procedure outlined in Datsiou and Overend (2018). This method was preferred for its effectiveness for small sized glass strength data, as it produces a better goodness-of-fit and was found to provide more conservative estimates at lower probabilities of failure compared to other manual calculation and computational methods.

where Pf is the probability of failure, β is the shape factor and θ is the scale factor of the Weibull distribution.
The Anderson Darling (AD) goodness of fit pAD (Eq. 3) is commonly used in glass statistics to assess whether the Weibull distribution provides a good fit to the fracture data under consideration (Datsiou and Overend 2018). This method employs a weight function giving greater emphasis to the upper and lower tail of the cumulative distribution function which is essential in glass statistics as low probabilities of failure are typically considered for design purposes. The AD goodness of fit was therefore selected in this study for a chosen significance level of λ = 0.05.

where
![]()
where i is the index of ascending order and n is the sample size.
Strength data were subsequently derived for the design and mean probabilities of failure to compare results across different series. A design probability of failure of Pf = 0.008 was selected in this study following the recommendations of ASTM E1300-16 (2016) but any other appropriately low probability of failure could be used.
3 Results and discussion
3.1 Externally facing glass surface
Microscopy of the externally facing glass surface (S1 in Fig. 2) revealed extensive damage, predominantly pits and some scratches (Fig. 7). The damage can be attributed to the long-term exposure of the surface to the external environment. Pits were likely caused by the impact of airborne projectiles, as well as transport, installation and cleaning processes that were likely also responsible for the observed scratches. This is consistent with previous observations in Datsiou and Overend (2017a), and more recently in Stuurstraat (2023).

Five series of test data were analysed for externally facing glazing derived from five distinct IGUs (Table 1). Fracture data were acquired from the tin side of glass for series IGU1-S1T and IGU4-S1T while the remaining series (IGU2-S1A, IGU6-S1A and IGU7-S1A) featured data from the air side of the glass. All series showed acceptable goodness of fit to the Weibull distribution (Table 3), exceeding the 5% significance level selected for this study. The sole exception was IGU4-S1T which exhibited poor goodness of fit. The fracture data for this series are arranged in two distinct groups (Fig. 8), suggesting that the data from each group arose from different flaw typologies. Consequently, it is expected that this series would be better described by a bi-modal Weibull distribution.
Table 3 Weibull statistics and fracture strength for externally facing glass (surface S1) - Full size table

The cumulative distribution functions (CDFs) for all series exhibited a consistent trend, with each curve being nearly parallel to one another (Fig. 8). Indeed, it was found that the shape factor, β, which governs the gradient of the CDF of the Weibull distribution, was low and very similar across all series, within the range of 3.51 ≤ β ≤ 4.1. This indicates the wide spectrum of the obtained fracture strength data and closely matches previous findings on the shape factor of naturally aged glass in Datsiou and Overend (2017a). Low shape factors are expected for naturally aged glazing as it is subject to uncontrolled and random flaw inducing mechanisms during its service life.
Close agreement was observed in CDFs for series IGU1-S1T and IGU4-S1T, both of which featured fracture strength data on the tin side of glass. Similarly for the air side data, series IGU2-S1A and IGU6-S1A were closely aligned. A small deviation was observed for series IGU7-S1A which, however, converged with the other two for strengths at low probabilities of failure. It is evident that the tin side series consistently resulted in lower strength compared to the air side. Overall, the strength of glass varied between 19.9 ≤ σf,0.008 ≤ 27.4 MPa at low probabilities of failure (Pf = 0.008) with a coefficient of variation of 13.8% while the mean fracture strength ranged between 60 ≤ σf,0.5 ≤ 76.1 MPa with a coefficient of variation of 19%.
3.2 Cavity facing glass surfaces
Micrographs recorded on the cavity facing glass surfaces (S2 and S3 in Fig. 2), exhibited nearly defect free conditions. Figure 9 shows two micrographs of the cavity facing surface, where a rare instance of damage was detected: a widely spread scratch on surface S2 (Fig. 9a, specimen IGU5-S2T-4) and pits on surface S3 (Fig. 9b, specimen IGU4-S3A-13). Given that the cavity facing surfaces were protected during the lifetime of the IGU, the damage might have been caused during assembly or disassembly of the units. In subsequent destructive tests, the observed flaws did not initiate the fracture of the specimens, indicating that a more severe flaw was present on the surface, but was not detected through surface microscopy.

The fracture strength of a total of four series of cavity facing glazing were investigated for four distinct IGUs (Table 1). For each cavity facing surface, namely S2 and S3 of the external and internal glass panel (Fig. 2), two series were tested (IGU3-S2A & IGU5-S2T for S2 and IGU1-S3T & IGU4-S3A for S3). Among those, one series pertained to the air side of glass while the other to the tin side of glass.
All series successfully met the goodness of fit criteria for the Weibull distribution (Table 4). However, significant variation was observed in the CDFs among the tin and air side series for both S2 and S3 surfaces (Fig. 10). Specifically, series IGU3-S2A and IGU1-S3T demonstrated an increased shape factor of 6.4 and 7.8 respectively. This aligns with findings for as-received / non-aged glass (Overend and Louter 2015) and is a reflection of the narrow spread of the fracture strength data.
Table 4 Weibull statistics and fracture strength for cavity facing glass for surfaces: (a) S2 and (b) S3 - Full size table

However, low shape factors of 2.1 and 3.3 were found for series IGU4-S3A and IGU5-S2T which were accompanied by a wide range of fracture strength data of 45 ≤ σf ≤ 206 MPa and 80 ≤ σf ≤ 173MPa, respectively. These shape factors were even smaller compared to those reported for externally facing glazing in Sect. 3.1. The cavity facing surfaces remained protected within the IGUs against flaw inducing mechanisms during transportation, installation and their service life. Consequently, uniformity in fracture strength data was instead expected. As mentioned, flaws introduced during assembly and/or disassembly of the IGUs could be potentially the underlying reason behind this discrepancy. Additionally, in the case of series IGU5-S2T, this could be also linked with flaws induced due to contact with the tin bath during the float process. Further future post fracture microscopy is essential for characterizing critical flaws in these series to fully understand the reasons behind this deviation.
Overall, the strength of glass at low probabilities of failure (Pf = 0.008) varied between 30 ≤ σf,0.008 ≤ 67 MPa for S2 and 14 ≤ σf,0.008 ≤ 46 MPa for S3 (Fig. 10). The upper limit of these series matches the bending strengths of glass reported in Datsiou and Overend (2017b) and Overend and Louter (2015), however, the lower end indicates that more severe damage was evident in the glass specimens of this study. Meanwhile, the mean fracture strength ranged between 116 ≤ σf,0.5 ≤ 129 MPa for S2 and 84 ≤ σf,0.5 ≤ 116 MPa for S3.
3.3 Internally facing glass surface
On the internally facing glass surface (S4 in Fig. 2), significant damage was observed, predominantly scratches (Fig. 11a), likely caused by cleaning, and some severe local pits (Fig. 11b), which might have been caused by an impact with a hard object during installation, use or dismantling and disassembly.

Five series of test data were analysed for internally facing glass surfaces derived from five distinct IGUs (Table 1). Fracture data were obtained from the tin side of glass for series IGU2-S4T, IGU5-S4T and IGU7-S4T while series IGU3-S4A and IGU6-S4A featured data from the air side of glass. All series were successfully fitted to a two parameter Weibull distribution, meeting the selected goodness of fit criteria (Table 5).
Table 5 Weibull statistics analysis and fracture strength for internally facing glass surface S4 - Full size table
It was found that the shape factor, β, of the Weibull distribution was low and ranged for all series between 3.2 ≤ β ≤ 4.7. This range was in close agreement with the one reported for the externally facing glazing, indicating that large variability in data was also apparent in this case. Although internally facing glazing was protected from outdoor elements during its service life, such as wind-borne projectiles, it was nonetheless subjected to ageing mechanisms stemming from normal indoor use and cleaning. These processes could have resulted in the induction of flaws that were randomly dispersed on the glazing surface.
CDFs for series IGU5-S4T and IGU7-S4T featuring tin side data, were almost identical (Fig. 12). However, the CDF for IGU2-S4T intersected the other two at approximately Pf = 0.55 and diverged considerably at low probabilities of failure. A fairly good agreement was found for the air series IGU3-S4A and IGU6-S4A although some discrepancy was observed at high probabilities of failure. It is worth noting that all series, irrespective of the side of glass used for acquiring the data, met at low probabilities of failure except for IGU2-S4T. Overall, the strength of glass varied between 19.1 ≤ σf,0.008 ≤ 30.3 MPa at low probabilities of failure (Pf = 0.008) with a coefficient of variation of 19.3% while the mean fracture strength ranged between 53.6 ≤ σf,0.5 ≤ 86.7 MPa with a coefficient of variation of 20.2%.

3.4 Overall comparison
Fracture strength data for each of the four investigated surfaces, namely, externally facing glazing (S1), cavity facing glazing (S2 and S3) and internally facing glazing (S4) were grouped for all tested IGUs and were subsequently statistically analysed to allow direct comparison across different surfaces. Acceptable goodness of fit was noted for series S1, S2 and S4 (Table 6). S3 failed to conform to the selected goodness of fit criteria, although a visual inspection suggests a better fit to a bi-modal Weibull distribution (Fig. 13). Consequently, series S3 is excluded from further discussion in this section.
Table 6 Weibull statistics analysis and fracture strength for externally facing glazing (S1), cavity facing glazing (S2 and S3) and internally facing glazing (S4) - Full size table

Interestingly, very close agreement was found for CDFs of series S1 and S4 (Fig. 13) indicating that the externally and internally facing surfaces experienced similar levels of ageing during their service life. However, further post fracture microscopy is required to determine and compare the type and morphology of critical flaws found on both surfaces. As anticipated, the CDF of the protected, cavity facing surface, S2, was shifted along the horizontal axis towards higher strength values compared to surfaces S1 and S4. The coefficient of variation for surfaces S1 and S4 was very similar (32.8% and 34.5% respectively) whilst a lower coefficient of variation of 25% was found for S2.
Strengths at low probabilities of failure (Pf = 0.008) were found to be 19.8 MPa and 17.9 MPa for externally and internally exposed surfaces S1 and S4 respectively, indicating a 11% higher strength for externally facing glazing. In turn, the cavity facing surface exhibited a strength of 46.3 MPa at Pf = 0.008, denoting a 234% and 259% increase compared to exposed surfaces S1 and S4 respectively. This increase is attributed to the fact that surface S2 remained shielded from ageing within the IGU during its service life.
Observed strengths at low probabilities of failure, which correspond to design strength used in engineering applications, present a considerable potential for reuse. Design strength of new annealed glass under a 60s-load, calculated according to EN 16612:2019 (CEN 2019) for infill panels (consequence class CC0), equals 21.4 MPa. In comparison, surfaces S1 and S4 reach 93% and 84% of the design strength of new glass, respectively, while the surface S2 even exceeds it by a factor of 2. However, it should be noted that the tested surface was relatively small, potentially resulting in higher strengths due to the size effect. While the strength of the externally facing surface may not exhibit significant size dependence due to its highly dense and uniformly distributed damage, the specimen size might be a relevant factor for determination of the design strength of the cavity facing and internally facing surfaces, where a presence of more singular defects was observed (Veer et al. 2023).
With a possibility of non-destructive pre-detection of critical flaws and exclusion of potential outliers, the strength achievable with reused glass might be greater. The surface microscopy applied in this study proved to be limited in this respect. However, a number of tools and methodologies for glass surface quality assessment are currently in development, which can further facilitate the reuse of glass, such as optical scanner (Rota et al. 2023), optical profilometer (Veer et al. 2023) and non-linear acoustic method (Karlsson et al. 2023).
The applied test method with particularly small test surface area (DL/DS = 18 mm/90 mm), although yielding a higher number of specimens per glass pane/test series, resulted in a high number of invalid tests, i.e. specimens which failed outside the loading ring (Table 2). Percentage of valid tests ranged from 36% (IGU3-S2A) to 86% (IGU1-S3T), with an average of 52%, significantly reducing the data sets for statistical analysis. This puts in question the feasibility of the EN 1288-5 test method for the (comparative) analysis of the bending strength of aged glass. As observed by Rota et al. (2023), a larger test surface area (e.g. DL/DS = 80 mm/150 mm) increases the probability of detecting a critical defect, resulting in a higher percentage of valid tests with a fracture origin within or directly under the loading ring, which can also have an influence on the dispersion of the strength data.
4 Conclusions
The present study examined the surface quality of seven IGUs retrieved from a refurbishment project after 30 years of service life, focusing on the comparison of the four IGU glass surfaces. Qualitative assessment though microscopy revealed that glass quality was best preserved on the cavity-facing surface, which consequently exhibited the highest bending strength. The internally and externally facing surfaces, with visibly more extensive damage, exhibited similarly lower strengths at low probabilities of failure. When compared to the design strength of new annealed glass acc. to EN 16612, all the surfaces showed a reuse potential, with considerable bending strength.
Strengths at low probabilities of failure, which correspond to design strengths used in engineering applications, were found to be 19.8 MPa and 17.9 MPa for externally and internally exposed surfaces S1 and S4 respectively. This indicates a 10% higher strength for externally facing glazing, contrary to the expectation that externally facing glazing suffers the highest level of weathering. Further post fracture microscopy is required to determine and compare the type and morphology of critical flaws found on both surfaces. As anticipated, the cavity facing surface exhibited a 234% and 259% increase in strength at low probabilities of failure compared to exposed surfaces S1 and S2, respectively, reaching a strength of 46.3 MPa. This increase is attributed to the fact that surface S2 remained shielded from ageing within the IGU during its service life.


