Article Information
- Digital Object Identifier (DOI): 10.47982/cgc.9. 567
- Published by Challenging Glass, on behalf of the author(s), at Stichting OpenAccess.
- Published as part of the peer-reviewed Challenging Glass Conference Proceedings, Volume 9, June 2024, 10.47982/cgc.9
- Editors: Christian Louter, Freek Bos & Jan Belis
- This work is licensed under a Creative Commons Attribution 4.0 International (CC BY 4.0) license.
- Copyright © 2024 with the author(s)
Author: David Entwistle - Saint-Gobain Glass

Abstract
Closed loop recycling of end of life building glass rarely happens, with most glass manufacturers declaring less than 1% post-consumer content in their new glass. Instead, it follows a linear process and is often crushed together with other building materials and put into landfills or recovered to low grade fill applications. Could this be the most important challenge for the glass industry, as we consider strategies for combatting embodied emissions and creating a circular economy? This paper will utilisethe findings from the author’s MSc Façade Engineering thesis and explain both the background to the study and how the lessons learned are now being applied. The thesis examined the barriers to recovering end of life glass from commercial projects in London, and identified the drivers that will open pathways for glass to be recycled. Data was collected from 57 interviews with key stakeholders (clients, developers, main contractors, façade engineers, architects, demolition contractors, waste management companies and cost consultants). The nature and scale of an investigation such as this, had not been undertaken before. This paper will explain how the lessons learned are being realized into a new way of working by dealing directly with clients and equipping the existing deconstruction supply chain. This provides a ‘cost and time’ effective solution and guarantees that end of life glass is being recovered back to new building glass.
1.Introduction
It was estimated (Hestin et al., 2016), that the UK produces approximately 200K tonnes of glass waste per annum from demolition and renovation. But despite its recyclability, end of life building glass is almost never recycled into new building glass. Instead, it is often crushed together with other building materials and put into landfills or recovered to low grade fill applications.
1.1. Background
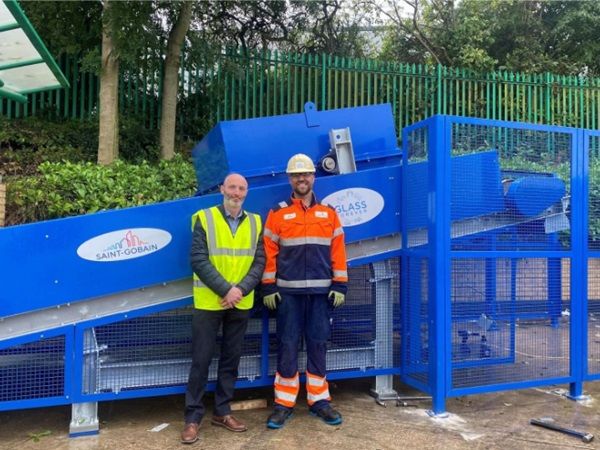
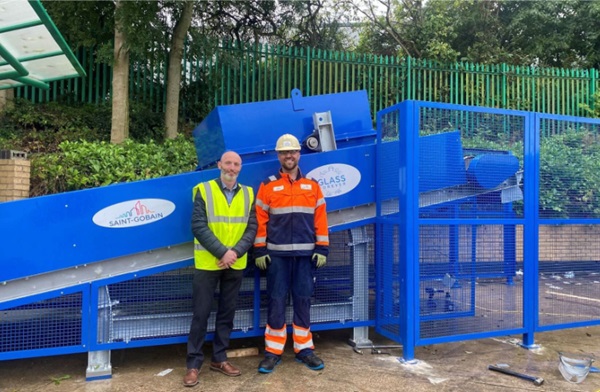
By 2021, we had seen advances in the recovery of pre-consumer cullet (mostly offcuts from glass processors) in the UK and some post-consumer cullet (end of life) from companies operating in the domestic glazing market (e.g., Morley Glass, Fig. 1).
While continuing to develop end of life recovery of domestic glazing, we started to consider strategies for the commercial market. The distinctives between the domestic and commercial markets are covered in section 2.2.
1.2. Cullet Conundrum
Cullet is of major importance for the glass Industry. Re-melting existing glass to form new flat glass has great environmental benefits. It reduces energy consumption (taking less energy to re-melt glass than to melt the equivalent amount of raw materials), reduces CO2 emissions (some of the raw materials include carbonates which release carbon dioxide), saves natural resources and reduces extraction.
In general terms, each 10% increase in cullet usage results in an energy saving of 2-3% in the melting process and each tonne of cullet used saves between 230-300kg of CO2 emitted when compared to manufacturing glass with 100% virgin materials (Glass for Europe 2010, Glass for Europe 2013, Hartwell R et al., 2022, DeBrincat G et al., 2018). The CO2 savings are based on Scopes 1&2 (direct emissions from economic activity and indirect emissions from energy utilisation) as classified in the Green House Gas Protocol 2001.
Glass manufacturers are starting to declare Scope 3, which covers all indirect emissions that occur up and down the value chain, outside of their production. The significance of the inclusion of Scope 3 means a tonne of cullet represents a further saving of circa 400kg CO2, creating a total overall saving of circa 700kg in the production of one tonne of glass.
Whist other important solutions such as alternative fuels and decarbonisation of raw materials are being developed, their implementation is still some time away. Increasing the recycled content of glass with post-consumer cullet has an immediate impact in terms of reducing carbon and raw material extraction.
However, cullet presents a major challenge to the glass manufacturers because of the potential risks that contaminates, hidden in the broken cullet, bring to glass production.
Post-consumer cullet is more likely to contain harmful contaminates and so glass producers protected themselves by setting their acceptance criteria high (i.e., having a very low tolerance for any contaminates). Effectively this became a barrier to getting glass back.
It was estimated that the quality requirements for cullet to be returned back to building glass is around 20 times more demanding when compared to that required for the glass container industry (Vieitez et al., 2011).
The consequences arising from the challenges of cullet quality are twofold. Firstly, pre-consumer cullet (the offcuts from glass processors) is a valuable commodity, as it is low risk in terms of contaminates and is easy to integrate back into glass production. Therefore, there is competition across the glass industries (flat glass, glass containers and glass wool) for this. Secondly, the post-consumer glass that can be recovered, is considered high risk and is mainly used by the container and glass wool producers.
1.3. Who?
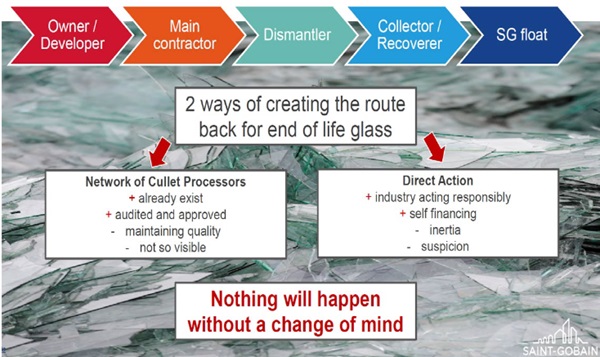
The first question we considered is who should be recovering the glass. We considered that there were two options (as seen in Fig. 2).
Within the waste management industry there already exist several glass recyclers / cullet processors, mainly because the recycling of container glass is well established. Some of them take flat glass, most of which does not find its way back to flat glass, for the reasons outlined above.
The first option was to develop this network and work with them to combat the challenges of cullet quality. You could call this indirect action through a third party. The advantage of this approach is that it would be a simpler task to take something that exists and work to improve it.
There were several downsides.
- The time and cost required for cullet processors to upscale their operations would be a medium to long term process.
- Our pathway to net zero (including responsible use of raw material resources) determines there will be an increasing dependency on post-consumer cullet. Strategically do we, as a glass producer, want to have a third party controlling the culet supply?
The second option was direct action and it was mainly posited as an alternative to the first option. It was a concept around the key stakeholders taking responsibility. It involved moving from a “someone will do it” attitude to “we will do it”.
Although naive and optimistic it started a chain of events which took about 2 years to develop into a successful strategy.
1.4. How?
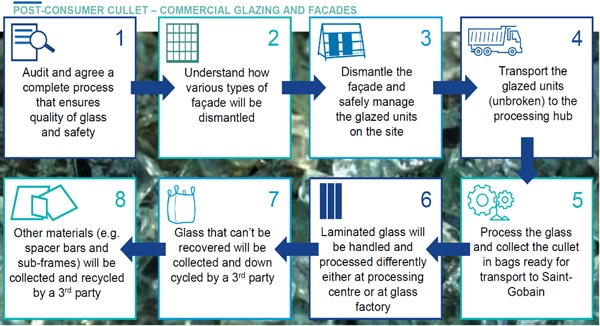
The second subject we considered was how the glass would be recovered. The simple flow chart in Fig. 3 illustrates what we considered at the time. Although theoretically sound and possible, we were unable to answer the cost and time questions that came from clients.
In October 2021 we were approached by McLaren Construction to consider the glass recovery on a project called Chalcots Estate in London.
In considering glass recovery and returning it to glass production, the transport costs alone were too high for the project. This started us considering a strategy different from what we had originally conceived and over a period of 6 months we managed to bring the costs down by 85% to a point that was then accepted by the team. Glass started returning towards the end of 2022. Chalcots did not provide the blueprint for the future, but it made us look at the issues differently.
The subsequent study, conducted for the MSc thesis, was utilised to explore what we already knew, determine what was lacking and consider how we could establish something that could work.
2. MSc Thesis - Identifying the drivers that will open pathways to recover end of life building glass from commercial projects in London.
The study, in the summer of 2023, was focussed on end of life building glass (post-consumer cullet). Glass that has served its purpose may be considered end of life for some of the following reasons.
- Out of warranty.
- Beyond its expected service life as an insulated glass unit (IGU).
- Ongoing costs of maintenance, repair, replacement.
- Inefficient in terms of thermal performance.
- Part of a dated looking façade that needs to be replaced to attract new tenants.
In person interviews were conducted to address 5 key questions.
- What currently happens to end of life glass on projects?
- Why is glass, a 100% recyclable material, not recycled?
- What influences current practice?
- What drivers could change current practice?
- Who should/could be driving change?
2.1. Research Significance
Although many of the challenges of returning post-consumer glass back to flat glass are well understood, there was a need for greater engagement from stakeholders.
The nature and scale of an investigation such as this, had not been undertaken before. This was an opportunity to further explore what needs to be done and how this could be achieved.
Previous research (e.g., DeBrincat et al., 2018, Babic et al., 2021, Hartwell et al., 2021) had not gone to the same depth to comprehend the underlying motivations to recover end of life glass (EOLG). The personal nature of the interactions afforded by the semi-structured interviews allowed participants to explore their own reasons why they would be motivated to effect change.
2.2. Scope of Research
The research uniquely included clients, developers, main contractors, façade engineers, architects, demolition contractors, waste management companies and cost consultants, within the same study.
It was important to engage with personnel at a senior level, in particular those with a passion for sustainability and with a strategic overview of their business.
The client/developer group was a primary focus of this study. This was important, because ultimately they can implement change through their development process (as summarised in the Employers Requirements).
The number of interviews conducted was 57. The split between stakeholder groups was as follows.
- Client/Developers (14)
- Façade Engineers (14)
- Main Contractors (11)
- Demolition Contractors (7)
- Architects (5)
- Façade Maintenance Companies (3)
- Waste Management Companies (2)
- Cost Consultants (1)
Previous research (e.g., DeBrincat et al., 2018, Babic et al., 2021, Hartwell et al., 2021) had not made the distinction between glass from the commercial sector and residential (single family dwellings) sector.
- Commercial: Large quantities of glass in a few locations, but more challenging to reprocess.
- Domestic: Small quantities of glass in many locations, but easier to reprocess.
The study undertook to explore the commercial sector as a single entity.
The study focussed on London. It is the capital city of the largest commercial construction market in Europe (Euroconstruct 2018). London is a microclimate of commercial construction activity, and the largest market for most of the major façade contractors in Europe.
2.3. Research Approach
Interviews were conducted via Teams over a 6 week period. This was necessary due to the large number of stakeholders and the length of each interview (typically 1 hour). The interviews were framed around 10 discussion points which were designed to address the 5 key questions outlined in the introduction of this section.
A semi-structured approach was used as the interview questions were more thematic and their emphasis varied between the stakeholders. This enabled the participants to explore their thoughts on what needs to be done, how this could be achieved and why they would be motivated to effect change.
The nature of the questions and the ensuing discussions meant that data was recorded by extensive note taking with audio-recording (after having gained permission from the interviewee).
The data emerging from circa 60 hours of interviews was analysed through qualitative coding. This was a systematic process of organising the data, labelling it, and identifying themes and the relationship between them.
2.4. Review of Responses
There were 57 interviews conducted. The abbreviated versions will be used throughout the analysis.
- CD = Client/Developers (14)
- FE = Façade Engineers (14)
- MC = Main Contractors (11)
- DC = Demolition Contractors (7)
- AR = Architects (5)
- FM = Façade Maintenance Companies (3)
- WM = Waste Management Companies (2)
- CC = Cost Consultants (1)
Most of the stakeholder groups had the following responses in common.
1.What currently happens to end of life glass on projects?
EOLG was removed by the demolition contractor but there was no clear understanding of what happens to it.
Over 90% of the 4 larger groups (CD, FE, MC and AR) identified the demolition contractor as dealing with glass removal. In response to the question of what happens to it, there was a 50/50 split between the “don’t know” replies and “segregated as waste/crushed into aggregate/sent to landfill”. Nearly 50% of FE thought that EOLG was going to landfill. Nearly 50% of CD thought their EOLG was being segregated on site.
All the DC stated that glass was mainly recovered as mixed waste. If segregated on site or separated at a waste transfer station, it could be purchased by specialist glass recyclers.The WM confirmed that within London, where diversion from landfill is >95% for construction and demolition waste (CDW), most segregated EOLG ended up as aggregate, not as landfill, with a small quantity taken by the specialist glass recyclers.
Of that sent to glass recyclers, some was used as aggregate in breeze blocks, some taken by the container industry, with a small amount returning to building glass.
2. Why is glass, a 100% recyclable material, not recycled?
The biggest barrier to recovering EOLG was the lack of a reverse supply chain.
From the CD perspective 49% of the comments were about the lack of a reverse supply chain and finding the right partners to enable a circular economy. 21% were related to programme and site issues (e.g., health and safety), 16% to cost, 7% to legal/warranty issues, and 7% to other factors.
From the FE perspective 49% of the comments were about the lack of a reverse supply chain, 13% were related to programme and site issues, 9% to cost, 1% to legal/warranty issues, 19% to technical glass issues, and 9% to other factors.
From the MC perspective 44% of the comments were about the lack of a reverse supply chain, 20% were related to programme and site issues, 28% to cost, 3% to technical glass issues, and 5% to other factors.
From the DC perspective 23% of the comments were about the lack of a reverse supply chain, 32% were related to programme and site issues, 27% to cost, 14% to technical glass issues, and 4% to other factors.
From the AR perspective 55% of the comments were about the lack of a reverse supply chain, 10% were related to programme and site issues, 15% to cost, 5% to technical glass issues, and 15% to other factors.
From the other 3 groups (FM, WM, CC), 40% of the comments were about the lack of a reverse supply chain, 13% were related to programme and site issues, 20% to cost, 0% to legal/warranty issues, and 27% to technical glass issues.
3. What influences current practice?
The planning requirements, especially the circular economy (CE) aspects, of the London Boroughs, City of London and the Greater London Authority (GLA) were the most significant current driver and were seen as becoming more onerous. Client requirements/aspirations were the next most significant driver and were growing (apart from the client group for whom it was the utilisation of Environmental Social and Governance (ESG) benchmarking of investors).
Green building labels were important because they were well recognised but thought of as not being challenging enough due to a lack of focus on embodied carbon.
For CD 54% of external influences related to the GLA, London Boroughs and any other legal requirements (e.g., EPCs, financial disclosures), 26% related to investors and ESG benchmarking criteria, 17% to green building standards, and 2% to other factors. Of their internal influences, 43% were commercial, 26% about renumeration/bonuses, 5% regarding CE issues, 5% related to involvement with trade bodies, and 21% other factors.
For FE 40% of external influences related to the GLA, London Boroughs and any other legal requirements, 20% to client’s requirements, 8% to investors and ESG benchmarking criteria, 26% to green building standards, and 6% to other factors. Of their internal influences, 12% were commercial, 8% regarding CE issues, 50% related to involvement with trade bodies, and 30% other factors.
For MC 33% of external influences related to the GLA, London Boroughs and any other legal requirements, 37% to client’s requirements, 23% to green building standards, and 7% to other factors. Of their internal influences, 14% were commercial, 43% regarding CE issues, 29% related to involvement with trade bodies, and 14% other factors.
For DC 60% of external influences related to the GLA, London Boroughs and any other legal requirements, 17% to client’s requirements, 7% to investors and ESG benchmarking criteria, 13% to green building standards, and 3% to other factors. Of their internal influences, 43% were commercial, 43% regarding CE issues, and 14% other factors.
For AR 42% of external influences related to the GLA, London Boroughs and any other legal requirements, 21% to client’s requirements, 11% to investors and ESG benchmarking criteria, 21% to green building standards, and 5% to other factors. Of their internal influences, 20% were regarding CE issues, 60% relating to involvement with trade bodies, and 20% other factors.
For the other 3 groups (FM, WM, CC), 75% of external influences related to the GLA, London Boroughs and any other legal requirements, 15% to client’s requirements, and ESG benchmarking criteria, and 10% to green building standards. Of their internal influences, 20% were commercial, and 80% related to involvement with trade bodies.
4. What drivers could change current practice?
Embodied carbon as it relates to the CE was regarded as increasing the desire for the recovery of building materials for re-use or recycling.
Having a reverse supply chain was seen as a major requirement for change.
Planning requirements and client aspirations (as discussed in the responses to question 3).
For CD, in summarising what was changing, 26% related to planning becoming more challenging, 33% to further ESG metrics from investors, 15% to increasing tenant requirements, and 26% to other factors. 2 of the CD group said that they were mainly self-funding and therefore not overly influenced by investor lead ESG metrics. 17% of change could be driven by national and local government actions/ legislation, 35% by changes in the supply chain, 11% from a greater awareness of CE principles, 17% by ESG requirements of investors, and 20% by other factors.
For FE, in summarising what was changing, 45% related to planning becoming more challenging, 29% to increasing client requirements, 6% to increasing tenant requirements, 10% to CE issues, and 10% to other factors. 22% of change could be driven by national and local government actions/ legislation, 16% by client requirements, 33% by changes in the supply chain, 9% from a greater awareness of CE principles, 7% by ESG requirements of investors, and 13% by other factors.
For MC, in summarising what was changing, 32% related to planning becoming more challenging, 32% to increasing client requirements, 10% to increasing tenant requirements, 15% to CE issues, and 10% to other factors. 44% of change could be driven by national and local government actions/ legislation, 19% by client requirements, 25% by changes in the supply chain, 6% from a greater awareness of CE principles, and 6% by other factors.
For DC, in summarising what was changing, 20% related to planning becoming more challenging, 30% to increasing client requirements, 30% to CE issues, and 20% to other factors. 25% of change could be driven by national and local government actions/ legislation, 20% by client requirements, 40% by changes in the supply chain, 10% from a greater awareness of CE principles, and 10% by other factors.
For AR, in summarising what was changing, 22% related to planning becoming more challenging, 44% to increasing client requirements, 11% to increasing tenant requirements, and 11% to CE issues. 36% of change could be driven by national and local government actions/ legislation, 22% by client requirements, 14% by changes in the supply chain, 14% from a greater awareness of CE principles, and 14% by other factors.
For the other 3 groups (FM, WM, CC), in summarising what was changing, 25% related to planning becoming more challenging, 25% to CE issues, and 50% to other factors. 49% of change could be driven by national and local government actions/legislation, 17% by client requirements, 17% by changes in the supply chain, and 17% by other factors.
5. Who should/could be driving change?
The government was regarded as being the primary agent who should/could be driving change, closely followed by the client.
CD stated that those who should make this change were 60% government/legislation/GLA and 40% clients.
FE stated that those who should make this change were 48% government/legislation/GLA, 39% clients, 9% supply chain and 4% societal pressures.
MC stated that those who should make this change were 44% government/legislation/GLA, 37% clients, 13% supply chain and 1% societal pressures.
DC stated that those who should make this change were 33% government/legislation/GLA and 66% clients.
AR stated that those who should make this change were 48% government/legislation/GLA and 50% clients.
The other 3 groups (FM, WM, CC) stated that those who should make this change were 75% government/ legislation/GLA and 25% clients.
Considering the split across all stakeholders, 49% considered the government could/should be driving change, 41% clients and 10% other.
2.5. Conclusions
Many of the drivers to open pathways had already been identified in previous studies and this was confirmed during the interviews. The interviews went further in that they uncovered the relative value and importance to the stakeholders.
Key new findings arising from this study.
- Lack of a reverse supply chain was considered the greatest barrier by most interviewees.
- Insight gained into various motivational factors expressed by stakeholders.
- There was a strong pressure felt to do something and quickly.
- A change in mentality/thinking was required. We can’t keep doing the same thing and expect different results.
- Very little glass was going to landfill and this was not because of landfill tax rates.
- Generational differences exist within stakeholders, with the younger generation pushing for greater speed and depth of change.
- Stakeholders were not aware of where EOLG ended up.
The development of new pathways and supply chains for EOLG will be most effective where the stakeholders work collaboratively together to provide value to the client. Commitment to one another through strategic partnerships will enable the required investment of time, money and resources.
Annual glass production in the UK is well documented, but the scale of the volume of glass available for recycling is relatively unknown. Some commentators suggest that the figures identified in the Deloitte Report (Hestin et al., 2016) are somewhat conservative. Further research is required to provide detailed analysis of the end destination of current glass production.
3. An Evolving Strategy
In 2021 our early discussions with clients helped us to clarify the risks (see Fig. 4) that they perceived in considering a change from a “business as usual” scenario” in terms of building deconstruction. Cost and time were the biggest barriers and the pathway to getting glass back was undefined and unclear. We started talking about the cost/time test in how we assess potential strategies because they are related, and whatever is considered is likely to impact both. Several factors then converged over the next 12 months which laid the foundation for what we are now doing today.
The experience with Chalcots Estate in 2022 moved us away from the concept of the careful deconstruction of a façade where glass is removed on stillages, stillages are transported to a de-processing facility, and the glass de-processed and then either recycled or reused.
The MSc study was strategic in that at concept stage it set out to find the stakeholders that were wanting change, were more apt to adopt innovation but could not see how to accomplish it.
Pre-development and pre-demolition audits have become part of the planning requirements inLondon, identifying the embodied carbon of the existing building materials and making suggestions for reuse and recycling.
Deconstruction and demolition contractors were already reclaiming building materials such as steelwork, ceiling tiles, floor tiles, raised access flooring. They were motivated to work with us because this was an additional service for their clients, and they would rather not have someone else competing for this element of their works. We started to engage with them in the summer of 2022 and over the next 12 months began to explore how we could work together.
Clients were ready to welcome any workable solution that enhanced their net zero strategy and their ESG credentials with their investors and tenants.
From our perspective end of life glass was not getting back into glass production in any meaningful volume, so we realised the following principles (see Fig. 4) which shaped our strategy moving forward.
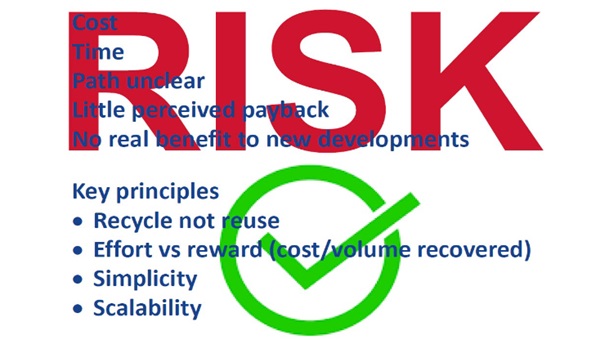
3.1. Recycle Not Reuse
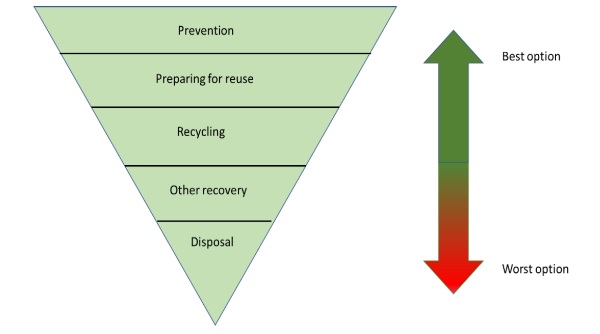
Prevention and reuse sit above recycling in the waste hierarchy (see Fig. 5) included in the EU Waste Framework Directive (2008/98/EC). We have chosen to focus our current efforts on recycling for the reasons listed below.
What we know.
- Virtually no end of life glass finds its way back to new glass production.
- Cost and time are linked to the “reverse supply chain” and are the biggest barriers.
- Many clients in London would not reuse toughened glass on their buildings (and it cannot be resized)because of the risk spontaneous breakage of toughened glass caused by nickel sulphide inclusions.
What we are unsure of.
- The service life / life expectancy of the seals on an IGU.
- The residual strength of glass at the end of its current life.
- The risk of temperature and humidity to laminated glass as it is being recovered.
- How to deal with CE Marking and DOPs for reused glass.
3.2. Effort Vs Reward
If effort is the cost and time required, then it is weighed against the reward, which would be the value it represents to the stakeholder. What the reward represents to each stakeholder (and it will differ between stakeholders) will directly influence the effort they are prepared to invest.
In order to make this effective, we need to understand what would motivate a change in behaviour and establish the threshold between action and inaction.
3.3. Simplicity
The fact that glass recovery is not working indicates that it is not simple. It is possible to segregate glass waste into skips on site and someone will take them away and use words like “remelt” and “recycle” but the glass just does not find its way back. To prevent glass disappearing and to create a closed loop scenario we needed to make the whole process simpler.
We identified the key ingredients to make the deconstruction process simple and quick.
- Utilise the existing deconstruction companies.
- As far as we can, have the glass broken and bagged on site.
- Take glass from site and return in directly back to our production plant in the UK.
- Issue a certificate to the client confirming the tonnage of cullet returned, the amount of raw material avoided and the saving in CO2 emissions.
3.4. Scalability
Acknowledging that we have an enormous issue (>200K tonnes of glass waste per annum) we determined that we should focus our efforts on solutions that could start on a smaller scale but can be easily adapted to handle large volumes of waste glass. One of our potential bottlenecks was our cullet sorting and screening facility at the production plant. As a result this was upgraded in 2023.
4. Strategy Realised
The MSc study highlighted the importance of having a “reverse supply chain” and it was crucial that the provision of this did not fail the cost/time test. Otherwise, we considered that this would be a severely limiting factor in making progress, except for the most determined and wealthy clients.
Although there is no “one size fits all” we have maintained our principles because we believe that this will produce the greatest impact, on the greatest number of projects, in the shortest time. It is a timely solution which deals with “what can we do now” and “what will have the biggest effect now”. It will continue to evolve and adapt, and possibly it could change towards reuse if, for example, government intervention was ever to drive it in that direction.
There have been a few projects where the façade (mostly window systems) has been removed by a façade contractor, but the demolition contractors are dealing with the majority of projects.
The simplest solution was therefore to work with the existing demolition/deconstruction companies rather than to create a new system.
A key component from our side was to have a project manager to undertake site assessments, create reports with an outline a methodology to recover uncontaminated glass, train the site teams, undertake a trial glass breakage and handle the logistics of getting the glass back.
4.1. Deconstruction on Site
The common method for demolishing the façade was to break it up onto the floor plate and remove the debris in bins to skips. Sometimes the glass would be segregated, but often not. Facade glass was often filmed to prevent fragments falling out onto the external scaffold.
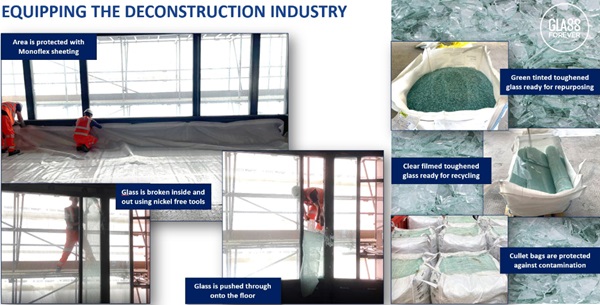
The challenge was how we could modify this method (see Fig. 6) whilst still satisfying the cost/time requirements and keeping the risk of contaminates to a minimum.
We accomplished this by visiting sites in London and producing a summary of the most effective ways of recovering the glass. The demolition/deconstruction contractor would then adapt this to work in with their methodology in tendering for contracts with clients.
Once the contract was awarded, we would be present for a trial deconstruction to finalise the glass recovery methodology and the logistics for returning the glass to our production facility.
The “adds” and “omits” (in terms of cost/time) of this, compared to a business as usual scenario, are in the hands of the deconstruction companies and not easy to quantify from our side. We have examples where our method was quicker and easier and other cases where it was not. However, in working to minimise the time/cost factors, the result has been the majority of clients are embracing end of life glass recovery for their projects.
4.2. Training and Education
We have created, and are continually updating, a suite of training and education materials which are primarily used by the site teams of the deconstruction companies.
This includes.
- Explaining what we can and cannot recycle.
- Glass identification.
- Glass recovery examples.
- Site preparation.
- Contamination risk examples.
- PPE for glass handling.
- Glass breaking and cutting tools.
- Logistics and transport.
4.3. Bulk Transport
Cullet has a value to glass producers as a substitute raw material.
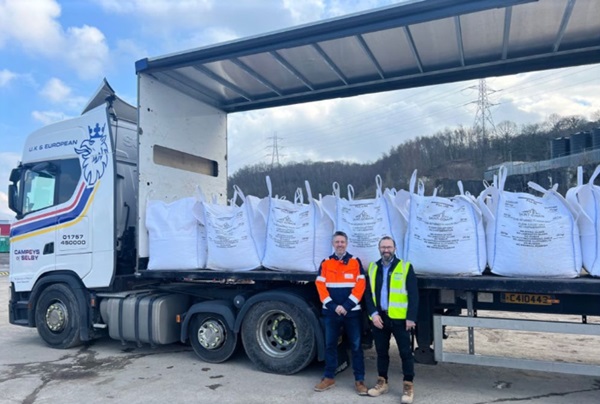
We typically develop the strategy around glass being recovered in 1 tonne cullet bags and then returned in 18- 20 tonne loads back to our production facility (see Fig. 7). If we can recover glass in this way, then we should be able to pay something for it and cover the cost of the transport. Where this is not possible then we do have a range of options, but that could mean that rather than us paying for the cullet, there may be additional cost to the project.
We are still exploring a range of options around how we deal with small quantities (< 20 tonnes) from a project.
4.4. Inside and Out
We started with a focus on glass recovery from façades. However, most offices have their interiors refurbished 2-3 times more frequently that the facades. This non-structural refurbishment is known as soft strip. Some deconstruction companies do general demolition (structural) and internal soft strip, whilst others specialise in one or the other.
There is often as much glass inside the building as there is on the facade. The principles for glass recovery remain the same but we are learning who are the key players in these two segments and are partnering with them.
5. The Future
In the short term there are several things that can be done.
- Broaden the uptake of glass recovery with our existing partners, i.e., more projects.
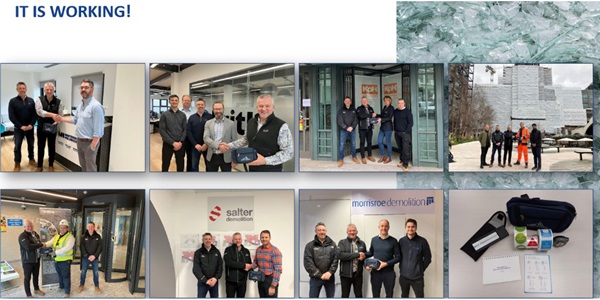
- Continue to train and equip our partners. In Fig. 8 we presented seven of our partners with a Merlin Laser kit to help them identify glass types.
- Collaboratively work to overcome some of the remaining obstacles to increase the volume of glass recovered from each project.
- Onboard new stakeholders into our partnership programme.
- Spread the good news and keep scaling up our activities. Examples of case studies are included in the references.
References
Babic, E., Dodd, G., Resnick, M., Entwistle, D., Gibson, A., Hayez, V., & Erlbacher, E.: Reversing the Supply Chain: Recovery of IGU Components. Glass Performance Days. https://gpd.fi/wp -content/uploads/2022/09/GPD2022 (2021). Accessed 19 August 2023
Construction Products Association: Waste Hierarchy. https://www.constructionproducts.org.uk/media/557063/waste-hierachy.pdf (2022) Accessed 01 September 2023
DeBrincat, G., Babic, E.: Re-thinking the life-cycle of architectural glass. https://www.arup.com/perspectives/publications/research/section/re-thinking-the-life-cycleof-architectural-glass (2018). Accessed 17 October 2022
Euroconstruct: UK Report. https://www.euroconstruct.org/reports/ (2018). Accessed 07 July 2019
Glass for Europe: Recyclable waste flat glass in the context of the development of -end-of-waste criteria, Brussels: Glass for Europe (2010)
Glass for Europe: Recycling of end-of-life building glass. https://glassforeurope.com/publications/ (2013). Accessed 09 June 2023
Hartwell, R., Coult, G., Overend, M.: Mapping the flat glass value-chain. https://link.springer.com/article/10.1007/s40940-022-00195-9 (2022). Accessed 23 June 2023
Hartwell, R. Macmillan, S., & Overend, M. Circular economy of facades: Real-world challenges and opportunities. https://doi.org/10.1016/j.resconrec.2021.105827 (2021). Accessed 23 June 2023
Hestin, M., de Veron, S., Burgos, S.: Economic Study on Recycling of Building Glass in Europe. https://glassforeurope.com/publications (2016). Accessed 30 June 2023
Vieitez, E R., Eder, P., Villanueva, A., Saveyn, H.: End-of-Waste Criteria for Glass Cullet. https://publications.jrc.ec.europa.eu/repository/bitstream/JRC68281/jrc68281.pdf (2011). Accessed 25 August 2023
Case Studies
Barbour Product Search: Collaborative Success with John F Hunt Construction Firm. https://www.barbourproductsearch.info/collaborative-success-with-john-hunt-construction-news124092.html (2024) Accessed 14 May 2024
Clarke Facades: Carbon Savings at Kensington Forum Hotel. https://www.linkedin.com/feed/update/urn:li:activity:7181213991078121472/ (2024) Accessed 14 May 2024
Construction Management: Keltbray partners with Saint-Gobain for glass waste recycling scheme. https://constructionmanagement.co.uk/keltbray-saint-gobain-glass-waste-recycling-scheme (2024) Accessed 14 May 2024
Saint-Gobain UK & Ireland: Case Study KpH Group. https://www.linkedin.com/posts/saint-gobain-glass-uk_case-study-activity-7151511038549487619-9XZl/ (2024) Accessed 14 May 2024
Saint-Gobain UK & Ireland: Case Study Salter Demolition. https://www.linkedin.com/feed/update/urn:li:activity:7176508351906750464/ (2024) Accessed 14 May 2024
Saint-Gobain UK & Ireland: Case Study Sternfenster. https://www.linkedin.com/posts/saint-gobain-uk-%26-ireland_glass-forever-case-study-sternfenster-activity-7173650224886726657-i1V_/ (2024) Accessed 14 May 2024