Article Information
- Digital Object Identifier (DOI): 10.47982/cgc.9. 649
- Published by Challenging Glass, on behalf of the author(s), at Stichting OpenAccess.
- Published as part of the peer-reviewed Challenging Glass Conference Proceedings, Volume 9, June 2024, 10.47982/cgc.9
- Editors: Christian Louter, Freek Bos & Jan Belis
- This work is licensed under a Creative Commons Attribution 4.0 International (CC BY 4.0) license.
- Copyright © 2024 with the author(s)
Authors:
- Sophie Pennetier - Enclos, USA
- Baizhen Yu - SCI-Arc, USA

Abstract
Our research examines the viability of recycling soda lime glass from post-consumer Insulated Glass Units (IGU), mixing various types of architectural glass cullet and fusing them into flat plates by using electric kilns. Those kilns operate at lower temperatures than standard float glass production, which significantly reduces manufacturing emissions. The research outcomes suggest the potential for near-site operations, reducing transportation logistics, costs, and emissions. Strength and emissivity tests were performed on the recycled glass samples, to assess challenges arising from various production parameters including: glass types, processing methods, annealing temperatures and schedules, cullet sizes and distribution. These explorations offer high-level perspectives for developing post-consumer glass solutions driven by emissions and logistics primarily, and tectonics secondarily, exploring thecost-effective diversion of glass products from landfill to generate solutions staying within the built environment. The research examines performance aspects of recycled glass as emblematic of sustainability in design and underscores the role (and implications) of texture in architectural materiality. Performance and viability are weighted with considerations for the US market (hauling distances, energy grid emissivity across states, market culture, labor rates, incentives, or lack thereof). This exploration proposes innovative avenues for integrating distinctive, sustainable recycled glass as a hallmark into architectural frameworks.
1.Background
The current state of the climate crisis requires all hands on deck to decarbonize the built environment which represents nearly 42% of worldwide human emissions (Architecture2030, 2023) for both embodied carbon emissions (materials production through construction) and operational carbon emissions (building use). Whilst many environmental metrics span beyond the mere (simplified) carbon emission metrics, this represents, right now, one of the highest contributors to human’s impact on our ecosystem’s boundaries, as well as a (simplified) way for designers and manufacturers to communicate the scale of the environmental impacts of the construction sector.
Facades are at the crossroad of embodied and operational carbon emissions since their design balances energy loads and losses throughout operation. They require project specific, energy gridspecific carbon assessment and design. At project scale, façade carbon improvements primarily stem from optimizing massing and orientation, window to wall ratio, active and passive shading strategies, coupled with thermal and solar optimization of glazed facades. To simplify, reducing the whole life carbon emissions associated with facades starts with consideration on how much glass we use and where we use it. While the glazed areas are getting established, their upfront environmental impact, including embodied carbon, shall be optimized.
Glass is traditionally made by heating limestone, sand, and soda ash to approximately 1500°C. The heat source is primarily fuelled by natural gas, contributing to 80% of carbon emissions in glass production (Joseph Eid. 2021) By incorporating more cullet into the process, the heating temperatures and associated emissions can be reduced. For instance, 10% more cullet in a furnace lowers CO2 emissions by 2% to 3% compared to using raw materials exclusively (Glass Magazine, 2022). Float glass manufacturers are investigating broadly in decarbonizing float glass with these two levers (energy source and cullet).
While glass is theoretically infinitely recyclable, not all post-consumer float glass cullet can be returned to the production of new float glass. Traces of aluminium, or nickel and tungsten contained in stainless steel, risk contaminating the glass batch with inclusions jeopardizing structural integrity, which has critical safety consequences and processing cost implications. This is the reason why major float glass manufacturing companies are developing strict disassembly protocols and equipment, as well as narrow cullet specifications to design out this issue. Emergence of these rigorous approaches work well with climate-conscious markets ecosystems (e.g. project teams, project type, legislative context) yet fall short integrating other markets and projects at the pace and scale necessary to decarbonize the glass industry.
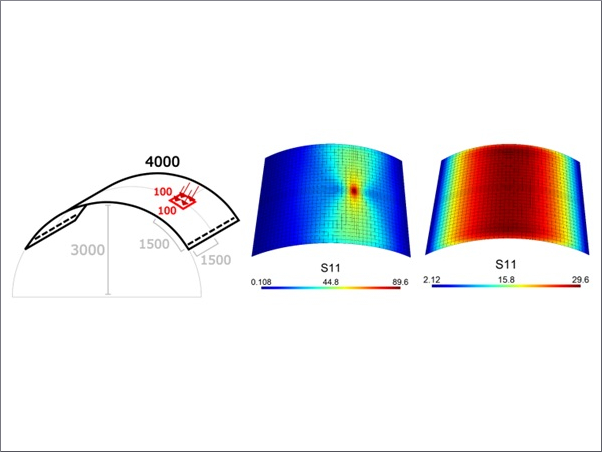
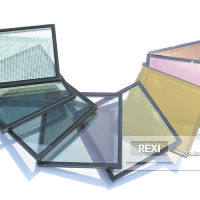
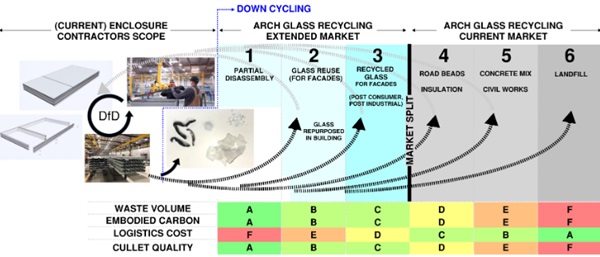
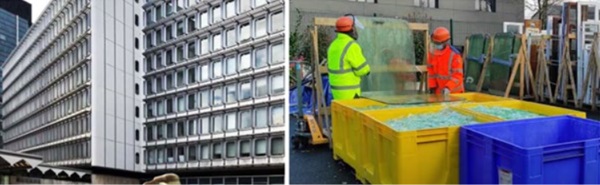
While glass manufacturers are scaling circular glass in conditions amiable with their processes, our research team evaluates complementary pathways to keep glass in facades for one or more lifecycles, before it gets downcycled into glass insulation, beads, concrete binder or aggregate, or the inert landfill compactor as it is often destined to in the US. Figure 1 illustrates circular pathways for post-consumer glass, with limitations and opportunities driven by costs, logistics, means and methods. There have been successful experiences in the US and Europe with regards to reusing glass, or recycling glass, such as the Unesco project in Paris (Figure 2). The success of these projects was due to early-adopter owner buy-in and favourable policy landscape which are not yet transposable at scale to the US market. Meanwhile, the research herein explores product development opportunities in lesser favourable project settings.
Inspired by the work from Telesilla Bristogianni, Faidra Oikonomopoulou, and their colleagues at TU Delft in the Netherlands, our research team evaluates glass reprocessing and design within the market specificities of Los Angeles, California.
California ranks amongst the highest real estate and labor costs market in the US. As such, it is a favorable market for factory-assembled unitized systems, speedy installation, enabled by high-cost equipment and limited near-site storage. If only considered through these terms, downtown Los Angeles may be comparable to markets like London or Paris. But the lack of legislation and local incentives (both constantly evolving), together with construction trends or expectations in markets flooded with high-quality cost-competitive overseas materials supply, threatens the economic viability of reuse friendly glass removal from buildings due to handling and equipment costs andstorage. Higher disposal fees and cullet resale value could be a great catalyser of market change, alongside labor tax incentives, storage facilities, and architectural design appetite, creativity, and acceptance. In California, the updates to the CalGreen legislation coming in effect in July 2024 encourages building structure and façade reuse and will hopefully encourage change through itsreduction targets and emission thresholds for construction materials. This policy applies to commercial buildings above 10,000 m2 and school buildings above 5,000 m2. In its current version, this policy mandates carbon emissions reporting, and is expected to incrementally reduce carbon thresholds in the upcoming years.
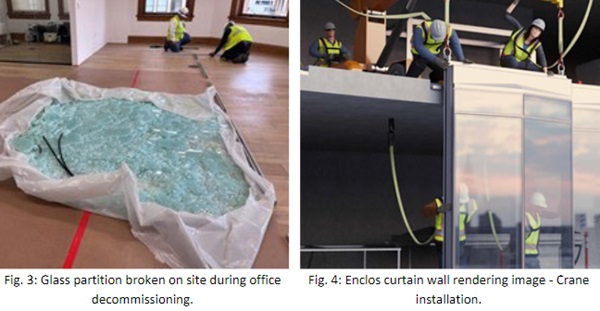
The size and weight of the glass panes stock in donor buildings significantly impact disassembly means and methods, costs, and transportation logistics. Commercial and residential applications differ, the ladder is not evaluated here in. Harvesting glass in multi-story large scale commercial buildings presents the advantage of having a large glass volume or consistent sizes, which isfavorable with reducing fixed costs, potentially in a congested urban site, with little on-site storage potential. In commercial buildings most pieces destined to reuse would be handled with the use of suction cups and tethering. They will subsequently be stored and handled on A-frames. Such safety protocols aimed at preserving the integrity of the glass lites and avoiding onsite breakage results in slower means and methods, higher labor costs per ton of glass, routing logistics, and access requirements. However most typically today, glass lites are br oken down into large glass cullet bins equipped with casters and moved around through man lifts.
Any glass broken on site comports the risks of inclusion and future breakage mentioned hereinabove and most likely preclude the cullet use for float glass. Demolition chutes flanking mid-size buildings are also precluded, not only from a contaminant standpoint but also since large pieces of glass dropped from multiple floor heights may puncture the landing concrete slabs. As cranes are used to install new glazed curtain wall units on slab edges, one may suggest it could allow for the best removal process. It is however limited by the fact that glass in older facades systems is either contained into brittle gasketed systems or aging sealant beds therefore requiring heightened tethering and significant protection. In markets where extensive exposure to UV and high heat may not be as predominant as in the Southwest of the US, such observations should be revisited. Reclaimed glazed systems need integration in a thermally improved system (Zaccaria et al, 2023), which is likely to be another logistical premium, making this a non-desirable cost for any client in the California market, today, in the absence of significant policy change and incentives. Glass recycling’s fate here like in many other markets and industry is mostly driven by logistics and value-proposition.
Based on these observations of the Los Angeles market and its constraints, our research team chose to explore pathways optimizing the value proposition:
- “In cases where it will not be cost-effective to route architectural glass cullet back into transparent architectural glass, what is the highest value proposition and most circular purpose for the Los Angeles market?”
- “As shown in Figure 1 there are multiple avenues for lower grade cullet in the Los Angeles market towards glass insulation and concrete products, but what if we could keep the glass in the façade one last cycle before it translates into these less circular recycling paths?”
- “The current economics are tied to a low cullet price, what avenues may drive a higher value cullet trajectory towards a high-value low-carbon solutions for architecture?”
1.1. Approach
This study explores the feasibility of recycling soda lime glass from post-consumer Insulated Glass Units (IGUs), encompassing various glass types and the production of flat plates made of fused recycled glass cullet. By proposing an approach to bypass float line temperature constraints, the study aims at reducing carbon emissions and suggests local glass recycling to streamline transportation. Additionally, it assesses the performance of recycled glass as a symbol of sustainable design, emphasizing texture's significance in architectural materiality and considering US market-specific parameters influencing viability. Our team produced several 76x127x6mm (3x5x1/2in) flat plates of various types of recycled glass and subsequently subjected them to structural and spectral testing. We then assessed the samples from an embodied carbon and value proposition standpoints.
1.2. Method and materials
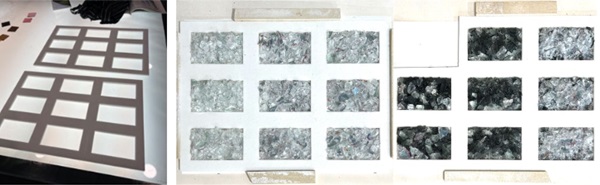
Glass panes were retrieved from IGUs and broken down to simulate project cullet, inclusive of contaminant traces from primary and secondary IGU sealant, potential steel and or aluminum tracesfrom tooling, spacer, and overall shop work environment. The glass culets size ranged from 10mm to 30mm in size typically and were arranged in pre-cut ceramic fiber insulation blanket formwork for samples 76x127x6mm (3x5x1/2in) in size (see Fig. 5). This arrangement was placed in a small electric kiln in which the cullets were fused. The heating process was concluded by an annealing phase to prevent excessive residual stresses and minimize the heightened risk of spontaneous breakage due to the surface irregularities and contaminants.
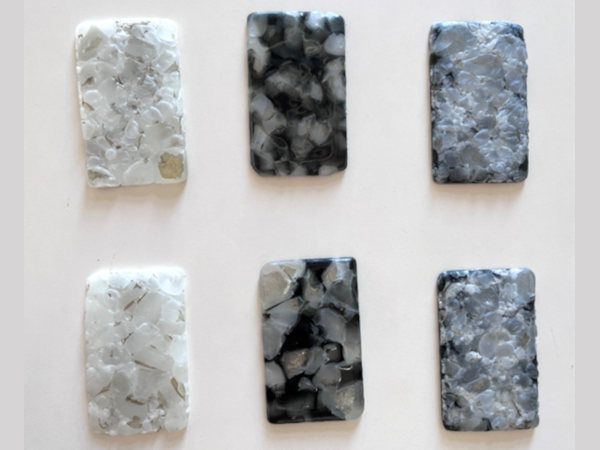
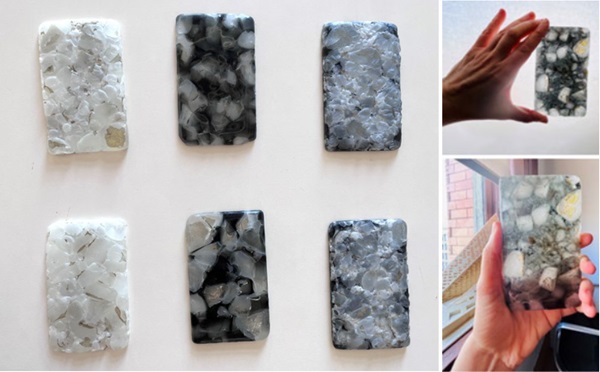
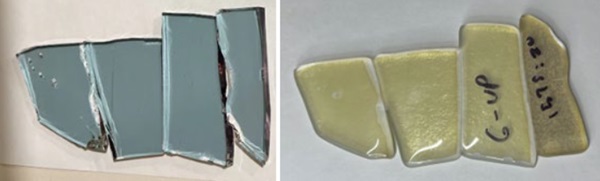
The experiments were conducted using a Paragon GL-24 kiln, which operates at a lower temperature range and much lower energy consumption range than gas-fired float line equipment, namely: 240V, 45 Amps, 1 Phase/60 Hz, and 10800 Watts. The maximum temperature range was 870 degrees Celsius. Fig. 6 displays representative samples produced. We observed a change of color of the low-E coated glass cullet which is discussed hereafter. We subsequently subjected the samples to structural and spectral testing.
The various glass cullets utilized in the experiments consist of the types listed below, which we composed into various mixes permutations. Since not all of them were tested, we do not detail here all our mixes permutations, they will be mentioned where pertinent hereinafter.
- G-010 - Heat-strengthened clear glass (uncoated)
- G-02A - Tempered Low-E coated low-iron tempered glass (Type A)
- G-02B - Tempered Low-E coated low-iron tempered glass (Type B)
- G-03C - Tempered Low-E coated clear tempered glass (Type C)
- G-040 - Annealed Body tinted borosilicate glass
2. Structural Testing
“Gravity is not just a good idea, it’s the Law” (Gerry Mooney)
The reason we use glass for windows instead of thin plastic films is because glass is a champion material: chemically inert, transparent, economically viable, and strong enough to carry high structural construction and operation loads. Most often in commercial projects, glass thickness is driven by serviceability i.e. deflection under lateral loads such as wind and live loads, above other critical minimum requirements of strength under gravity, seismic and thermal loads. In order to capitalize on new glass solutions development, viable solutions may find success in performing within a comparable elasticity domain first, then strength domain second, to that of current similar applications. Or if the domains of applicability of the products are not sufficiently comparable, the product shall be used in settings within domains boundaries overlaps. To put it simply, instead of searching to substitute existing optimized solutions, the goal is rather to aim for its best “structural ROI” (Return On Investment) for the product positioning and application within a building or, more simply “finding the highest value use of a waste product so that we divert it from landfill”. In architecture higher value may result from a wider size, from higher strength, from energy performance, from visually pleasing attributes, from chemically inert properties, to name those applicable to standard glass applications.
The 76x127x6mm (3x5x0.5in) samples were structurally tested with a 4-point bending apparatus. The spacing between the upper bracket touchpoints was 25.4mm (1in) on center. The lower supports were spaced 89mm (3.5in) on center. To spread the load uniformly, and minimize the concentration of the applied load between the upper bracket and the irregular surface of the glass, we used a Teflon pad between the upper bracket and the glass, as well as soft foam taped on the lower brackets. These materials were selected to slide and not structurally engage during the evaluation.
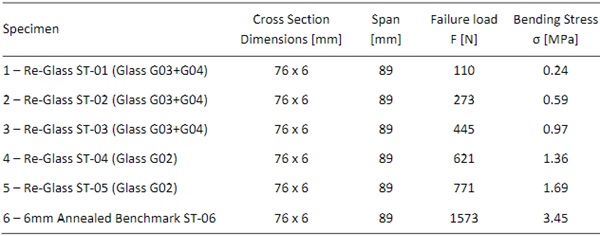
The force was introduced slowly as the upper bracket had an imposed displacement rate of 1.27mm/minute (0.05 in/min). The breakage pattern of the samples in relatively large pieces was similar to that of annealed glass, and the breakage occurred at geometrical irregularities such as: upper surface irregularities where the contact area is small and the load concentrates, or at inter-cullet fusion interfaces where the cross section of the sample was smaller than at the typical cross section. These points of rupture were generally near mid-span, near the upper bracket, as expected for a bending test. Fig. 7 and 8 illustrate the structural testing setup and list the rupture loads ranging from 110N to 771N for the mixed glass samples (25lbf to 160lbf) and 1573N (354lbf) for the annealed glass sample. It is worth noting that the annealed glass sample did not have arrised edges, so the glass was expected to break at a lower force than typically observed in architectural applications.
The glass samples broke near mid-span at approximately half of the annealed glass sample (with non-arrised edges). The lower structural performance compared to that of annealed glass stems from:
- Geometrical irregularities: peaks and valleys susceptible to load concentration during the test, reduced cross section at fused interface between the cullets;
- Material irregularities: air bubbles, fusion planes between cullets, flaws distribution related to annealing schedules.
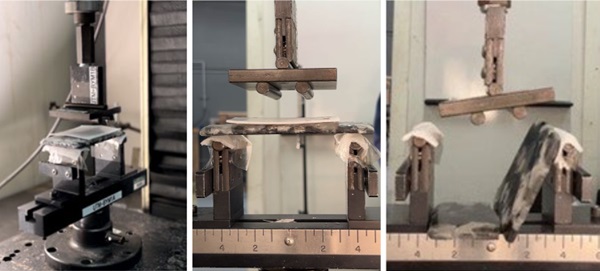
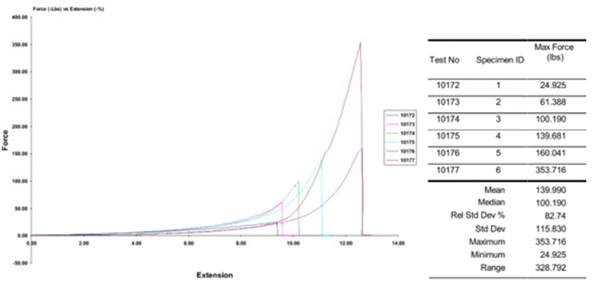
Table 1: 4-Point Bending Test results
3. Emissivity Test
Given the high intensity of the US energy grid and the predominance of operational carbon emissions drivers in the design and specification of glazing products, our team questioned not only how the structural performance could be salvaged and also how much of the energy performance could be salvaged. The circularity assessment of low-E coated glass raises the following questions: “can previously low-E coated glass be re-coated?” and “how does the low-E coating perform after it is reheated”. Our research aims at answering the latter. After producing our first series of exploratory benchmark samples, we observed that the low-E coating from our samples turned from blueish gray to a golden yellow tint.
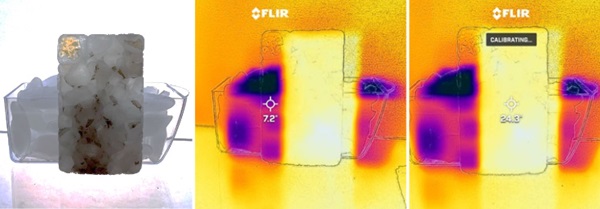
Our team used a thermal camera adapted onto a smartphone, to qualitatively understand whether performance of the low-E coating changed before and after burning (see Fig. 9). Fig. 10 presents on the left side image the configuration of the glass sample placed in front of an ice container. In the central image, using a thermal camera, measures the temperature of the ice through the plastic wall of the ice container (7.2 degC). The image on the right illustrates the measurement at the centre of the remelted glass sample (24.3 degC). Our team monitored the variation and the evolution of thetemperature across the outer surface of the multiple mixed glass samples considered. As the performance of the glass varied across the surface between the low-E and no low-E cullets within the mixed glass samples, and as we found similar trends in more homogeneous samples (e.g. sample pictured in Fig.9). We discussed our limited qualitative observations with experts and decided to perform further spectrometric testing on the samples. We will discuss further herein how the laboratory quantitative spectral assessments revealed our smartphone qualitative assessmentslimitations.
We contracted Optical Data and Associates to perform the following spectral tests:
- Transmittance in the solar spectrum (300-2500 nm)
- Reflectance in the solar spectrum (300-2500 nm)
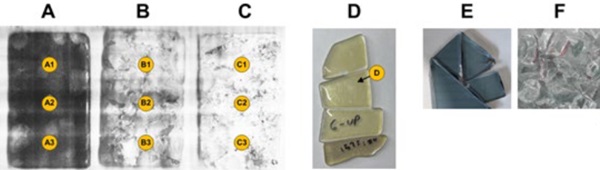
These spectral tests were performed on the samples listed in Fig.11. The larger mixed glass samples(A, B and C) were tested in 3 points when the equipment permitted, or 2 points otherwise. Fig. 12 illustrates the infrared and near visible light spectrum reflectance, most helpful to explain the performance of the low-E coated glass before and after the remelting process.
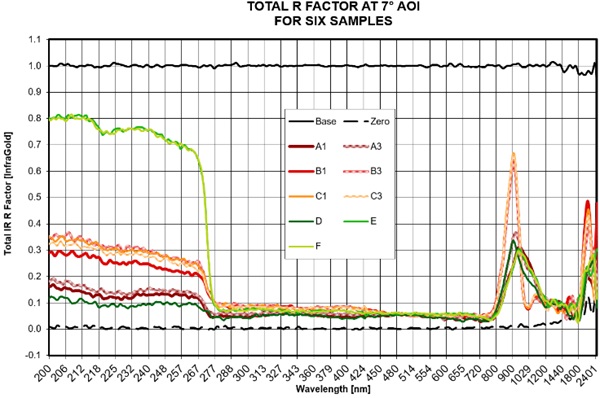
In Figure 12, the E and F curves represent low-E coated glass straight out of the IGU, before the melting process. In the infra-red domain, below 277 nm, the selective coatings perform as expected, blocking infra-red wavelengths (R:0.7-0.8). Those results corroborated the performance data from the low-E glass manufacturers. In the visible domain, all samples are relatively transparent (R<0.1). The peak at 940 nm is a signature of glass. We observed that the melting of the low-E coating materials with the glass at the surface very slightly shifted this peak, as expected.
The results on the mixed-glass samples (A, B, C) have limited potential for extrapolation due to the inaccuracy of the measurement method (surface irregularities, indexing, distribution) and resultsonly reflect local effects at the points tested, which in most cases are either clear glass (vitrified) and body-tinted glass. While we had initially opted to test those samples to encompass the possible impacts of the annealing schedules (temperatures and times) and any possible interaction between glass materials and various Low-E coatings, the results aren’t as valuable to the research proposition as the benchmark samples D, E and F, as detailed below.
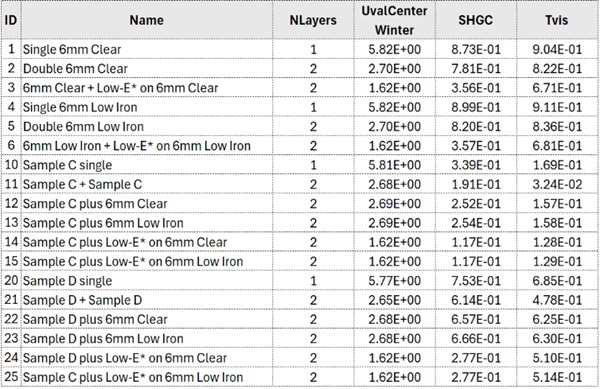
Sample D presents the most selective benchmark to evaluate the performance of the low-E after burn, for its lesser irregular surface (compared to other sample), in addition to the relative ease of indexing, calibrating, and performing the measurement. Comparatively to samples E and F where R=0.75 micrometres approximately in the infra-red spectrum, sample D presents R=0.1 (See Fig.12). Upon computing the Solar Heat Gain Coefficient (SHGC) and the Visible Light Transmittance (VLT) from the measured Transmittance and Reflectance, we observed a near-total drop in performance of the low-E coating after melting (see Fig.13). In the kiln, the surface materials melted and mixed with the upper surface of the glass, hence the emissivity of the sample is very close to that of a glass sheet. The emission barrier originally constituted by the low-E metals mix deposited on the glass were compromised once it diluted into glass. Furthermore, the transmittance was also altered, not only in the visible spectrum, where the colour shifted from blueish grey to yellow, but specifically in the infra-red where the surface no longer blocks sun radiation. The curve trends in Fig. 12 highlight howthe delicate work of the selective coating chemistry in the wavelengths below 270 nm was almost completely annihilated by the fusing process.
In conclusion, the only relevant remanence of the low-E coating after melting is its tint, and the glass sample D performs as a bright yellow body tinted glass. There is not, from our limited observations, any more spectral performance for these samples. To meet building energy codes, the glass will need to be integrated into an IGU together with an outboard low-E coated glass. Figure 13 lists out potential performances of the samples once integrated into an IGU. It is based on specific one low-E (used in sample B) and results may vary with any other low-E product. The authors do not recommend the use of these values for design. It is safest for design to assume that the post-consumer glass acts as if it is uncoated body-tinted glass.
4. Global Warming Potential
The carbon emissions associated with the manufacturing of these samples is skewed by their small sample size, the manual handling and overall lack of scalable information. However, to make a point about how this compares to the order of magnitude observed in mainstream glass production, we present the calculations herein, adjusted for 1 m2 of production of 6mm glass.
The equipment we used operated at 240 V, 45 Amps, 1 Phase/60 Hz, 10800 Watts. It can be used for the production of a sample up to 1m2 in size. We are assuming 0.86 pounds of CO2 emissions per kWh in the US (U.S. Energy Information Administration 2020) equivalent to 0.39 kgCO2eq/kwh.
Our research team did not have access to exact wattage consumed but assumed from the following representative firing schedule that we can use 4 hours at 60% duty cycle conservatively, according to our suppliers. In Fig. 14 below, the firing temperatures are in Degrees Celsius, and duration in Hours, and given for float glass. Note the temperatures for mixed glass are notionally smaller so this firing schedule is considered conservative for the purpose of Global Warming Potential (GWP) calculation of carbon emissions.
The GWP calculation then yields, for 1m2 of glass in a small kiln:
![]()
The next available kiln size, in which we can produce approximately 6m2 of material, operated at a wattage quadruple of our initial kiln size, which generates the following GWP:
![]()
Upon review, the authors anticipate the transportation emission to be lesser for the near-site recycling operations, to that of regular glass transportation mileage of raw materials or subsequent manufacturing stages.
Although the products are not functionally comparable, 1m2 of industry average 6mm cleararchitectural glass generates typically 21.45 kgCO2eq/m2 cradle to gate (NGA, 2019). Our coarse calculations, in need of further development, yield that our approach could scale up to be a -69% reduction on the embodied carbon of the glass. Most low-carbon glass, at the start of 2024, average around -40% reduction and are difficult to secure at scale on buildings.
We know that our assumptions are conservative, and we know that the energy grid in California has been decarbonizing at a rate of -2%/year per the past decade and targeting net zero by 2045. Simultaneously, glass float manufacturing is also decarbonizing. It is also worth noting that the short firing schedule may allow (by a stretch of imagination) for flexibility to leverage periods when the grid is 100% renewable (from solar, hydroelectric and wind powers), hence limiting the peaks who are driving the grid’s carbon intensity in the first place.

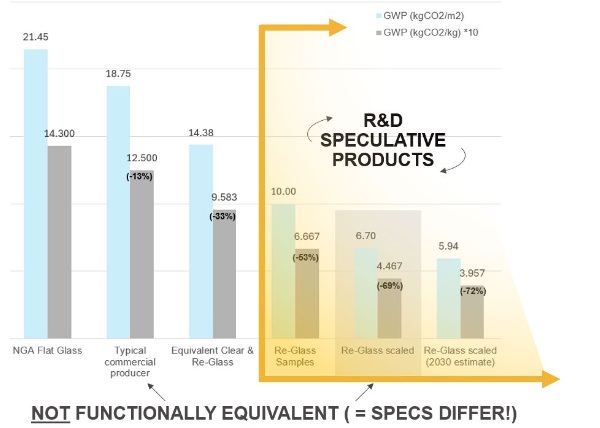
Since the recycled glass samples here in not pass the minimum energy performance required for infills in building enclosure (in addition to requiring further structural determination and approvals) it would likely to be used in an IGU together with a commercial low-E coated float glass, or in an interior laminated application. This combination yields an IGU (or a laminate) GWP range near theorder of magnitude of -33% reduction compared to the NGA Industry average Flat Glass EPD (2019)or most likely -41% if using our scaled baseline from GWP(6m2) above. In today’s market, the use of a Re-Glass IGU would virtually meet the national threshold for low-carbon glass by itself (GSA Low Embodied Carbon Pilot Fact Sheet, 2023). Again, this conceptual exploration is not destined to a commercial application without further development, rather to stir conversation and research.
5. Value Proposition
The cost associated with the dismantling, transportation, reprocessing of glass, integration into a thermally efficient IGU and curtain wall system are difficult to assess at scale. It needs to find its way into facades typically sold for 1000-1250 €/m2 (100-125$/sf) or a IGU ROM strictly below 500 €/m2 (50$/sf) or flat plates below 50 €/m2 (5$/sf). These are hypothetical values for conversation of the following proposition only, not representative of any average or any market statistical data.
The average residential electricity rate in California is 0.33 $/kWh, which is 73% higher than the national average rate of 0.19 $/kWh (Energysage, 2024) or 0.30 €/kWh. It is worth noting that typically commercial electricity rates are lower. While overheads, equipment, handling rates are hard to quantify and scale, the energy cost to produce 1 m2 of product in California (where the grid is decarbonizing rapidly) is about 5.7 USDm2 or 0.57$/sf (5.2 €/m2). It is not unfamiliar to observe general conditions consume a value equivalent to most of the remainder (crane, equipment, handling, storage, occasional breakage and replacement provisions, freight, insurance bonds) which one could extrapolate to the dismantling of old glass. Such expenses may be amiable with subsidies related to climate action or job creation, yet non-accounted for herein. The add cost remains for the cost of IGU manufacturing, from a recycled glass plate (produced to size) to a ready to ship IGU, and which may constitute the lion share of the premium (if any). Most commercial projects are likely to accept such a premium amplitude which is orders of magnitude below that of re-floating glass from post-consumer cullet. The authors here are not attempting to provide a narrow quantification for the glass product, rather to emphasize its viable value proposition on the US market.
6. Conclusion/ Discussion
From a structural and spectral performance standpoint, this brief qualitative research validated that the samples considered herein behave as body-tinted glass with a strength notionally lower to that of annealed glass and requiring further testing.
In terms of global warming potential, our coarse assessment of this product is that it yields 6.7kgCO2eq/m2, which is 64% less than a standard 6mm clear sheet of glass (18.75kgCO2eq/m2). Most low carbon products are near -40% reduction and are hard to source in the US market at the time of this research. This method and results represent a bridge material until new low-carbon glass solutions become mainstream, or until further decarbonization of the glass industry at large. It most significantly aims at limiting the large amount of architectural glass that finds its way into landfill or roads fill in the United States.
In terms of logistics, which are paramount in such product development, a local and low-carbon fabrication method allows for reprocessing of the glass near site, without traveling large distances across the United States. It also allows for rapid, lean implementation and dismantlement, which differs from that of standard gas-fired glass float lines.
This research has laid ground for alternative pathways of developing new products from the byproducts from the rapidly decarbonizing mainstream glass industry. Those solutions will not replace vision glass yet may find use in translucent areas of the façade, where vision is not critical (e.g. spandrels, partitions, interior wall cladding and tiling, etc.)
Most importantly, the value of the outcomes of this research lies beyond mere financial or carbon accounting. It bears on local craft, potentially associated with newly envisioned local jobs from deconstruction and manufacturing and has a history that is made visible in the texture and the color of the glass. In this way, it is a transparent glass product.
Acknowledgments
The authors wish to thank all collaborators and facilitators involved:
- SCI-Arc Embodied Carbon Advanced Studies Seminar,
- SOM LA for providing the glass samples used in this research,
- Judson Studios for glass samples manufacturing and guidance,
- Jacob Jonsson and Stephen Selkowitz from the Lawrence Berkeley National Laboratory for guidance on spectral assessment, data post processing in Window software,
- Optical Data Associates (ODA) for spectral testing,
- Specialized Testing Inc for structural testing,
- Enclos Coalition for the research and development time.
The authors also want to acknowledge and extend our gratitude towards our scientific community at large for inspiring this work and the collective effort in reducing our industry’s environmental impact.
References
“2030 Challenge for Embodied Carbon – Architecture 2030.” n.d. www.architecture2030.org. https://www.architecture2030.org/2030_challenges/embodied/.
“Electricity Cost in California: 2024 Electric Rates.” 2024. EnergySage. April 21, 2024. https://www.energysage.com/local-data/electricity-cost/ca/#:~:text=Electric%20rates%20in%20California.
“Environmental Product Declaration.” 2019. https://www.glass.org/sites/default/files/2019-12/NGA_EPD_2019_12_16_signed.pdf.
JOSEPH EID. 2021. “Glass Is the Hidden Gem in a Carbon-Neutral Future.” Nature 599 (7883): 7–8. https://doi.org/10.1038/d41586-021-02992-8.
“Low Embodied Carbon Pilot Fact Sheet.” 2023. Www.gsa.gov. December 12, 2023. https://www.gsa.gov/real-estate/gsa-properties/inflation-reduction-act/lec-program-details/lec-pilot-fact-sheet.
Rota, Astrid, Marco Zaccaria, and Francesco Fiorito. 2023. “Towards a Quality Protocol for Enabling the Reuse of Post-Consumer Flat Glass.” Glass Structures & Engineering 8 (2): 235–54. https://doi.org/10.1007/s40940-023-00233-0.
U.S. Energy Information Administration. 2020. “How Much Carbon Dioxide Is Produced per Kilowatthour of U.S. Electricity Generation? - FAQ - U.S. Energy Information Administration (EIA).” Eia.gov. U.S. Energy Information Administration. December 15, 2020. https://www.eia.gov/tools/faqs/faq.php?id=74&t=11.


")