The growing need for quality assurance
Quality is an important topic which caught many companies at their weak point in recent years, especially due to the economic crisis and the fact that customers are increasing their focus on brilliant quality received by their suppliers. This has created an enormous run towards quality control equipment and a clearly prioritized focus on quality assurance systems.
Due to the hard times many companies have had to overcome within the last years, it was interesting to see that bigger investments very often have been delayed, however, investments in accelerated quality assurance systems have been pushed forward and implementation is a top priority.
Just four or five years ago, during shows and presentations, manufacturers of quality assurance systems gained a great smile when companies responded with mostly the same answer: “Our quality is great and we have no demand to invest in such equipment.” Time would teach them the contrary within the next years and we expected it. Time also provided the needed evaluation period to design, program and customize products meeting the demands of the glass industry.
When the big growth finally started, companies were very selective about the position of their very first and fully automated “electronic eye” for quality assurance. Therefore, it is very important to understand a company’s production work flow and to consult potential customers properly on where to introduce the systems to catch glass quality issues at a very early stage of the glass manufacturing process. Any additional work step done on faulty glasses creates additional manufacturing and handling costs which shall be avoided at the earliest stage of production.
The sales forces, who are trying to sell quality assurance systems, really need to know all glass manufacturing processing in depth. Without this knowledge, it is impossible to consult companies during the preparation to invest into quality assurance.
Numerous samples prove how companies failed either during the decision or implementation process of such systems because the key points and most important milestones for these kind of decisions have just not been made properly due to lack of knowledge on the subject, on both ends.
Different production processes generate various surface defects
Bearing in mind what I have stated up to this point, I would like to first of all give everyone some information about very typical defects in the glass industry. Defects can be caused by different production processes of the float glass production or during glass processing and handling, and / or while additional value has been added to a particular glass sheet to create a customized finished good, ready to be shipped and / or installed on-site. That is one of the reasons to capture defects at the earliest stage during production possible, where glass is being processed.
Glass industry standards in different countries require 24/7 quality control with the same specifications and fully automated analyses and following statistics. State of the art software allows the operators to define those standards within the master files and get the quality evaluation done within the usual cycle times of the production line to provide 100% quality assurance. Even customer specific settings, as well as model specific settings, regarding minimum defect size per defect type can be achieved today. Human inspection has proven to fail in many cases because, after a certain time, the human eye gets tired or the operator just has too many other jobs to do at the same time, so that continuous inspection is impossible.
Anyone who is in the middle of the evaluation process with the target to implement a quality assurance system in the future will find that defects can be caused by the following reasons:
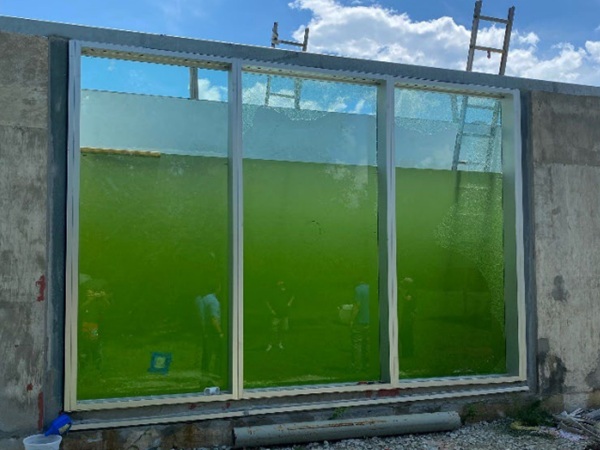
- Body Faults: defects which are within the body of the raw glass, caused by the float line like bubbles and inclusions
.jpg)
Click to enlarge
UserFiles/tab1big(1).jpg
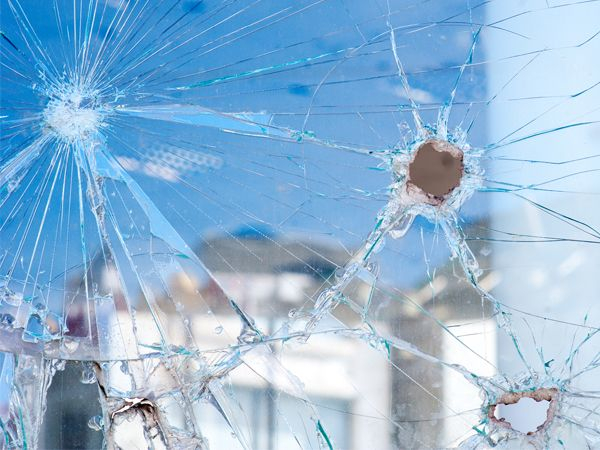
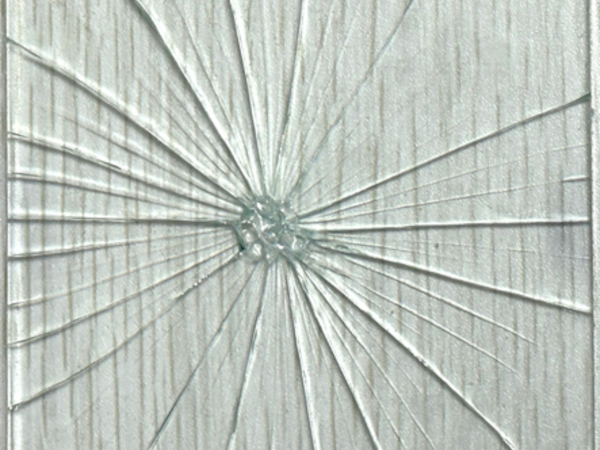
- Surface Damage: physical defects on the glass surface caused by handling like scratches, point marks, chips
.jpg)
Click to enlarge
UserFiles/tab2big(1).jpg
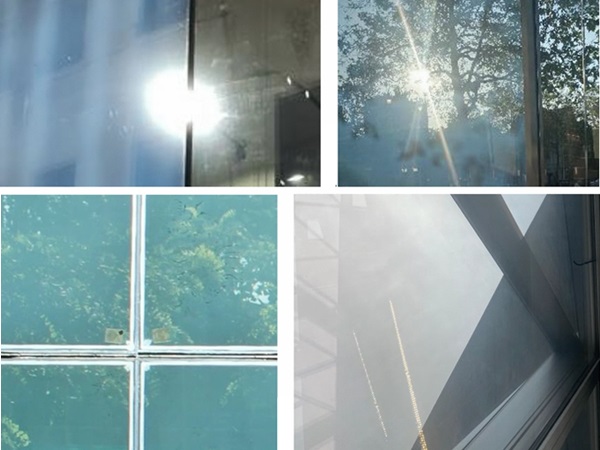
- Surface Contamination: faults which are on the glass surface and which may be removed by suitable cleaning like dirt, finger marks, brush marks, roller marks, cutting oil, water drops

Click to enlarge
UserFiles/tab3big.jpg
- Coating Faults: damages or defects in the coating like pin-holes, scratches and visible distortions in the coating
.jpg)
Click to enlarge
UserFiles/tab4.jpg
- Other defects: unexpected defects like insects on the glass surface which might have disappeared at the time of human re-inspection of the glass sheet

Click to enlarge
UserFiles/tab5big.jpg
On the other hand more and more automated glass identification systems are implemented, for example doing laser marking on the glass. Also toughened glass logos are directly applied to the glass.
These glass marking and identification methods should not lead to be displayed as defects so modern systems can read and interpret those logos, but will not cause any defect warning while glass is being processed through such quality assurance systems. Moreover, those systems will find things like toughening stamps and could then check the quality of the logo or read the data matrix code and use that information to identify the glass uniquely.

Click to enlarge
UserFiles/tab6big.jpg
Since colored glass scans are currently impossible to process because of its huge amount of data, reasonable quality assurance system works with a gray value scaled scan picture. Based on the gray value scale and gray value developed on the scanned image, the defect interpretation can start.
Historically, approximation methods have been used to find out the right defect category to evaluate, based on the size range allowed, to highlight a defect as such or to just ignore the defect because it was to small or an unimportant defect category.
Four main criteria have been used to approximate the defect category:
- shape of the defect (point or circle, line, irregular)
- length of the defect
- width of the defect
- depth of the defect
Here is a typical example for an air bubble in the glass and the gray value scale:
.jpg)
The analyses provide information that it is a round object with the exact gray value scale shown above. So it is easy to conclude that the category is an air bubble because all different types of defects have a certain shape and a certain 2D or 3D gray value scale.
Another example, this time in 3D, shows a scratch on a piece of glass
.jpg)
But could not a scratch also be a pen mark, dust or strand? How can it be clearly catogorized since the gray value scale, as well as the width and direction, look similar to a scratch?
Everyone who is developing software for this sort of business quickly understands these constraints. With approximation methods based on the gray value development in width, height and depth, it can be done, but as the method says: it can only be approximated and will never become a better result than 90percent of proper categorisation and never anywhere close to 100%.
Everyone who knows this problem has two options: accept it or try and find a better solution
Since real scientists are usually never happy with the result and they are never final results, they keep searching for this better solution. From my point of view it is to create and train a neural network, or more precise, an artificial neural network.
So what is an artificial neural network per definition?
“An artificial neural network (ANN), usually called neural network (NN), is a mathematical model or computational model that is inspired by the structure and/or functional aspects of biological neural networks. A neural network consists of an interconnected group of artificial neurons, and it processes information using a connectionist approach to computation.
In most cases an ANN is an adaptive system that changes its structure based on external or internal information that flows through the network during the learning phase. Modern neural networks are non-linear statistical data modeling tools. They are usually used to model complex relationships between inputs and outputs or to find patterns in data.”
The last 5 words in the definition are clearly defining the use of a neural network for accelerated quality assurance systems – to find patterns in data and use these patterns to find the defect category accordingly.

Artificial neural network
An neural network is typically defined by three types of parameters:
- The interconnection pattern between different layers of neurons
- The learning process for updating the weights of the interconnections (hidden)
- The activation function that converts a neuron's weighted input to its output activation
As I have tried to explain, it is quite tough to identify defects just based on different gray value intensities. Some parameters of the neural network offer full capabilities to feed it basic information from scanned data, so called features, to find the best result possible. Each feature (input) has a certain weight of importance and during the training process of the neural network these weights are adjusted, based on the output results via feedback. With the weight adjustments, the system is adjusted to its perfection.
So basically, the neural network uses some basic rules to identify what to do next and then uses a knowledge database to combine knowledge with news and combine them to the best possible result. When you have a representative database of samples, which describes different types of scratches, for example, it is much easier to categorize this defect as a scratch and, whenever a new imput arrived to the hidden area to analyze defects in depth, the final output is stored and therefore “learned” by the system.
Without that reference database, it is really tough to determine the difference between e.g. a scratch, a pen mark or a strand. They all have a very similar structure, but with a neural network the decision to find the right defect category is easy.
Conclusion
Progress is made in the development of all glass products every year, especially new coating types are introduced to the markets quite frequently. A neural network is the only chance to quickly adjust to the new market situation for quality assurance solutions providers. No re-programming is required, just feed the database with scan data of the new defects and the system provides instant improved quality assurance.
Whenever you go towards a decision process, please make sure that you analyze all demands of your company in depth and evaluate the current need, but do not forget the future. A brand new scanner combined with software might be outdated within the next year if it is not flexible enough to grow with the needs within your factory.
Ing. Christian Krenn - Softsolution GmbH


