Authors: Bliūdžius, R.; Miškinis, K.; Buhagiar, V.; Banionis, K.
Source: Buildings 2022, 12, 1239. https://doi.org/10.3390/buildings12081239
Abstract
Sound insulation design for structural glazed façade is an important task in environmental noise control, as increased continuously repeated noise is a significant factor impacting on people’s well-being and is associated with a negative impact on their health. For façades, in addition to sound insulation, requirements for safe use and high energy efficiency are also usually raised, which partly determine the composition of the glazing: triple insulating glass unit (IGU) with inner safety laminated glass sheet. Therefore, the aim of the research was to investigate the structural sealed façade structure with triple IGU and to determine the effect of the thickness of ordinary and laminated glasses, their position in the IGU, the thickness of the gas cavities, and the mass of the structural frame on the sound insulation level of structural glazing.
Experimental measurements of the sound insulation index of the investigated façade elements with IGU of various constructions were performed in an acoustic reverberation chamber according to standard procedures. The result of the study indicated that the use of the second laminated glass in a triple IGU is inefficient, the highest sound insulation indicators are achieved by increasing the thicknesses of the external glass sheet and the gas cavity; increasing the mass of the frame also has only little effect on the sound insulation of the structural glazing.
1. Introduction
Environmental noise is a significant factor influencing people’s well-being and is associated with a negative impact on their health [1]. The annoyance of people when exposed to different types of noise is frequently linked not only to the average levels of noise but also to the character of noise [2,3]. The most sensitive human hearing is at 1000 Hz sound frequency [4], but the most annoying noise is low-frequency noise [5–7], exceeding the hearing threshold below 200 Hz [4]. The sources of noise: transportation (road, rail, and air traffic), industry, construction, and public work [8] usually produces low frequency sound [4]. More specifically, an estimated 113 million people are affected by longterm day–evening–night traffic noise levels of at least 55 dB (A) [9]. Millions of people are exposed to high levels of road and railway traffic noise, aircraft noise, and of noise caused by industries and construction [9]. Sound insulation design for buildings is an important task in environmental noise control [10].
Façade sound insulation is the property related to the outside noise limitation to preserve indoor spaces [11]. Buildings’ glazed façades are the weakest element of the building envelope from the point of sound insulation [12]. The sound insulation of glass façades mainly depends on acoustic performance of insulating glass units (IGUs). The transmission of sound energy in a separation element proceeds by the vibration of the element and depends on the element mass and sound frequency. As the mass of the element increases, so does sound insulation as a result of increasing forces of inertia.
When the frequency of sound incident on an element that maintains the same mass increases, the vibration power of the element decreases and greater dissipation of sound energy is observed, leading to the rise in acoustic insulation. Besides these two variables, there are others, such as the angle of incidence of the sound waves, the existence of weak points in the insulation, rigidity, damping of the element and, in the case of multiple elements, the number of panes and their individual characteristics [7,13,14]. Therefore, sound insulation of IGU depends on the number of glass panes, their thickness, gas cavity thickness, and filling gas [13].
There are not many researchers investigating façade acoustic performance (in Scopus database it was about 200 in 2020), and there are almost no researchers who have studied the acoustic properties of triple glazing. However, the interest grows every year [11].
When there are only sound insulation requirements, they are usually met by using a double IGU with different thicknesses of ordinary glass or with one ordinary and one laminated glass. Nevertheless, to meet the requirements of energy efficiency, triple IGUs are used for glazing façades, especially in countries with a cold climate. It is important to investigate how the use of the second laminated glass in a triple IGU is efficient for sound insulation; can high façade sound insulation indicators be achieved by installing a sound reduction film in the laminated glass, installing a thicker outer glass or gas cavity gap, or increasing the mass of the IGU mounting frame? Therefore, the aim of this research was to investigate the structure of glazed façade with triple IGU and to determine the effect of the thickness of ordinary and laminated glasses, their position in the IGU, the thickness of the gas cavities, the presence of PVB film and the increased mass of the structural frame on the sound insulation level of structural glazing.
Section 2 presents the materials and methods used: an aluminium frame with cavities, filled with materials of various densities, glazed with three types of triple IGU, with one or two laminated glasses in different positions were used for the research. Experimental measurements of the investigated façade elements with IGU of various constructions were performed in an acoustic reverberation chamber.
In Section 3, sound insulation measurement results and analysis are provided: the dependence of the sound reduction index (R) of the measured specimens in 100–5000 Hz frequency range, and the comparison of single-number quantities; weighted sound reduction index (Rw) and weighted sound reduction index with living and transport adaption terms (Rw + C and Rw + Ctr, respectively).
Section 4 provides the discussion on the dependencies of the sound insulation indicators of the façade glazing, determined during the study, on the position of the second laminated glass, the sound reduction film, and the thickness of the gas cavity and on mass increment of structural frame. The research summarizing and rational criteria for achieving sound insulation indicators of the glazed façade are presented in the Section 5, conclusions.
2. Materials and Methods
The tested façade element (test specimen) consisted of the rectangular frame (30 × 198 mm cross section) fabricated of aluminium profile and triple IGU (Figure 1).

The thickness of ordinary glass sheets was 6 mm, 8 mm, and 10 mm and the thickness of laminated glass sheets was 8 mm, 10 mm, and 12 mm, respectively. Laminated glasses were connected with one or two films, parts of which were specially designed for sound reduction (marked as SR). The thickness of one film was 0.38 mm and of two films was 0.72 mm. Films were fabricated from PVB. The two films were glued together during production process. The thickness of gas cavity between glass sheets were from 14 mm to 20 mm with 2 mm increment. Gas cavities of IGU were filled with mixture of argon gas (95%) and air (5%). The non-metal spacers were used.
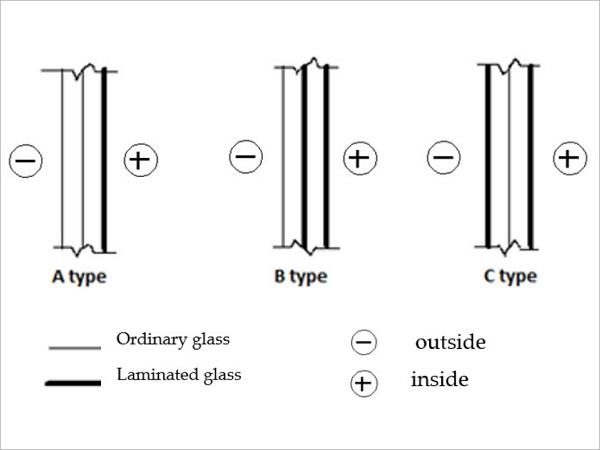
The specimens of three types of IGU according to the arrangement of the glasses were tested: (A) two ordinary sheets of glass (external and inner) and laminated glass (internal); (B) ordinary glass (external) and two laminated glasses (inner and internal); (C) and ordinary glass (inner) and two laminated glasses (external and internal) (Table 1 and Figure 2).
Table 1. Types of IGU.


The reasons of using of such type IGU are three in this case: Considering the physical phenomenon of sound attenuation, the noise wave coming from the outside should be stopped primarily by the external glass of the insulated glass unit, so it should primarily be solid or laminated. Furthermore, structural sealed glazing is usually installed over the entire height of the wall, therefore it is subject to the requirements of safe glazing, in which laminated glass is used for the internal glazing of the IGU. The inner glass is used for adding more mass to glass unit.
The specimens were divided into two groups: the first group (marked with the letter F in the specimen code in Table 2) has empty frames with different IGU, and the second group (marked with the letters FF in the sample code in Table 3) is partially filled frames (Figure 3) with different IGU.
Table 2. Specimens of 1st group (IGU in empty aluminium profile).

Table 3. Specimens of 2nd group (IGU in partly filled aluminium profile).


The frame filling materials were: gypsum fibreboard (10 mm thickness, density 1150 kg/m2); gypsum plasterboard (9.5 mm thickness, density 680 kg/m3), and steel S275 (10 mm thickness, density 7850 kg/m3). The length of materials inside the frame was 1079 mm in each side and 829 mm in top and bottom of the profile (Figure 3). The two 79 mm width material strips were placed into the frame close to each other (Figure 3).
The research was performed at the laboratory of Kaunas University of Technology. The acoustic test facilities (Figure 4) consist of double masonry walls of ceramic bricks with mineral wool interlayer, a double roof with mineral wool interlayer, and floating floors. There are two reverberation chambers: source and receiving (volume 79.95 m3 and 68.56 m3, respectively), separated by the wall (area 11.7 m2) with sound insulation R’max = 75 dB. In the separating wall, there is an opening for the test specimens (dimensions: 1500 × 1250 mm).
The test specimens were installed in the opening (Figure 5) and the gap between the frame and wall from both sides was sealed with a special airtight glass sealer (Perrenator TX2000). The frame in the test opening was rigidly fixed in seven points: two points at the bottom, two points at each side, and one point on the top. The IGU was fixed in the frame using press-fit metal glass strips with rubber gaskets from the source room side (mounted according to ISO 10140-1 Annex C as window). The measurement conditions (temperature 20 °C and humidity 50%) were kept constant in the test rooms during all the tests.
The measurements were performed in 100–5000 Hz frequency range in 1/3 octave bands according to LST EN ISO 10140 series standards (part 1, 2, 4 and 5) [15–18]. The results of measurements were evaluated according to the LST EN ISO 717-1 standard [19]. The system used for measurements consisted of noise spectra meter–generator Larson and Davis (L and D) 2800B [20]; microphone L and D 2560 with initial microphone preamplifier L and D PRM 900C [21]; dodecahedron (12 speakers) loudspeaker (generating pink noise in 50–5000 Hz frequency band of 110 dB level), power amplifier, and rotating microphone system (last three units were designed and fabricated at Kaunas University of Technology). The measurement system was verified by an accredited metrology centre [22].


For the evaluation of acoustic performance, the comparative measurements of tested elements were performed. The acoustic performance was described using the sound reduction index (R), weighted sound reduction index (Rw), and weighted sound reduction index with living and transport adaption terms (respectively Rw + C and Rw + Ctr). The sound reduction index R is the value of sound insulation at given frequency.
Weighted sound reduction index Rw is a single parameter, which shows the sound insulation of tested element in dB. The larger value of Rw is the better sound insulation of tested element. The spectrum adaption term is the value in dB added to the single-number rating to take into account the characteristics of particular sound spectra (living or transport noise). Rw + C and Rw + Ctr are single parameters, which show of how tested elements protect from living and transport noise. The larger the value of Rw + C and Rw + Ctr is, the better the sound insulation of the tested element of living and transport noise is [18,21].
3. Results
3.1. Analyses of Sound Reduction Index Dependence from Frequency
The frequency dependences of the sound reduction index (R) of the 1st group of Atype specimens are presented in Figure 6.

As can be seen from Figure 6, the curves of specimens F1-1, F1-2, and F1-3 in the analysed frequency range are of a similar character as specimens F1-4 and F1-5 which are flatter (no decrement) at the frequency range below 400 Hz. This is due to larger gap between 2nd and 3rd glass sheets and thicker 3rd glass in F1-4 and F1-5 specimens.
The sound attenuation of the specimen F1-1 is higher than that of the specimen F1-2, especially in the area of higher frequencies, although the internal side of the F1-2 specimen is equipped with thicker laminated glass (F1-1, 2 sheets of 4 mm thickness; and F1-2, 2 sheets of 5 mm thickness). The reason for this increase is the use of a special sound-absorbing film (SR) in the laminated glass of the F1-1 glass unit, which provides a greater attenuation effect than the 1 mm increased glass sheet thickness of the internal laminated glass. Comparing the sound attenuation data of specimens F1-1 and F1-3, which differ only in the thickness of the internal laminated glass, it was found that increasing the thickness of the internal laminated glass by 2 mm does not have a significant effect on the sound attenuation of the façade element. The same trend was observed when comparing the measurement results of specimens F1-4 and F1-5.
Comparison of the sound reduction indexes of specimens F1-3 and F1-4 showed that the influence of the gas cavity thickness (increased from 18 mm to 20 mm) is quite significant, especially in the low frequency (100–350 Hz) and higher frequency (550–5000 Hz) ranges. Unfortunately, there is a slight reverse effect in the frequency range between 900 and 1500 Hz.
Figure 6 shows that tested specimens have sound insulation ≥ 40 dB in frequency range 400–5000 Hz, except specimen F1-2, for which sound insulation drops about 3 dB below 40 dB at 500 and 2000 Hz due to the resonance and coincidence effect. In 160–400 Hz frequency range, the sound insulation of tested specimens is less than 40 dB but higher than 30 dB, except for specimens F1-1, F1-2, and F1-3 (<30 dB). The sound insulation of tested specimens is less than 30 dB below 160 Hz except for the specimens F1-4 and F1-5, which has sound insulation more than 30 dB. This shows that different thickness of gas cavity and thicker laminated glass increases sound insulation of IGU and of the glazed façade element.
At frequencies above 3150 Hz, sound insulation of all specimens is ≥50 dB, except specimens F1-4 and F1-5, for them sound insulation is ≥50 dB starting from 2000 Hz. The specimens F1-4 and F1-5 have sound insulation ≥ 60 dB in 4000–5000 Hz frequency range. From the graphs in Figure 6 it can be seen that when ordinary glass and gas cavity of the same thickness are used, and only changing thickness of laminated glass sheet, the sound insulation of specimens F1-1, F1-2, and F1-3IGU is very similar. However, when glass sheets and gas cavities of different thicknesses are used (specimens F1-4 and F1-5), sound insulation increases up to 10 dB in frequency ranges 100–315 Hz and 2000–5000 Hz. The place of resonance of these specimens moves to lower frequencies: from 2000 Hz to 1250 Hz due to stiffness change (higher bending stiffness).
The frequency dependences of sound reduction index (R) of the 1st group of B-type specimens are presented in Figure 7.

A comparison of the results of specimens with two laminated glasses, F2-1 and F2-2 and F2-3 and F2-4, which differ only in the film used for laminating the inner glass, showed that the use of a special sound reduction film in the inner laminated glass sheet of IGU does not have a significant impact on the dependence of the sound reduction index of the test specimen on the frequency and on the value of this indicator.
The use of thicker external glass (comparing F2-2 to F2-4) slightly increases the sound insulation index of the glazed element in the low (100–200 Hz) and high (2000–5000 Hz) frequency ranges, but even reduces it in the 600–2000 Hz frequency range due to the ongoing resonance.
The dependence of the sound reduction index on the frequency is close to identical for specimens F2-3 and F2-5, which differ in that the thickness of the external glass is increased by 2 mm and the thickness of the gas gap is reduced by 2 mm in specimen F2-5 compared with F2-3. This shows that the increased thickness of the external glass in place of the reduced thickness of the gas cavity is irrational from the point of view of increasing sound insulation.
Figure 7 shows that using IGU with thicker gas cavity and glass sheet (comparing specimens F2-1/F2-2 with F2-3/F2-4/F2-5) result in better sound insulation up to 8 dB in 630–2000 Hz frequency range. Therefore, sound insulation is almost equal in 160–500 Hz frequency range, due to the change in glass and cavity thicknesses combination variation. The resonances (Figure 7) of specimens F2-3, F2-4, and F2-5 shifts from 2000 Hz to 1600 Hz due to stiffness change (higher bending stiffness).
The frequency dependences of sound reduction index (R) of the 1st group of C-type specimens are presented in Figure 8.

Specimens F3-1 and F3-2 differ in that the external laminated glass of F3-1 IGU has a conventional film, and F3-2 IGU has a sound-reducing film. It can be seen from the graph presented in Figure 8 that the influence of the sound reduction film on the sound insulation of C-type specimens is not significant when this type of film is already used in the internal laminated glass.
The frequency dependences of sound reduction index (R) of THE 1st group of selected A-, B-, and C-types specimens are presented in Figure 9.
The dependencies of sound reduction index (R) on frequency of all types of test specimens were selected for further analysis (Figure 9). Comparing the dependence of F1-3 (A type) and F2-2 (B type), it was found that the glass units differ in that F1-3 only has the internal glass laminated, and in F2-2 the internal and inner glasses are laminated. The comparison results showed that the placement of laminated glass in the middle of IGU only slightly increases the value of the sound insulation index of the whole test specimen.
The measurement results of the specimen F1-3 (A type) were compared with the measurement results of the specimen F3-2 (C type) and it was found that the installation of external laminated glass instead of the usual 6 mm glass improves the properties of the structural glazing at low frequencies in the range 100–300 Hz about 6 dB, but in the range of higher frequencies (700–1500 Hz) it reduces by about 6 dB. The glass unit of specimen F1-4 (A type) only has internal laminated glass, while of F2-4 has both internal and inner laminated glasses, but the IGU of specimen F1-4 has 18 and 20 mm gas cavities, while that of F2-4 has thinner cavities, 16 and 16 mm.
The frequency dependences of the measured sound insulation coefficients of these specimens show that increasing the thickness of the gas cavity improves the sound insulation performance of the specimen much more than the use of inner laminated glass. In general, comparing C-type specimens with A- and Btype specimens, it is evident that an even curve in the analysed frequency range is obtained due to laminated glass position (1st and 3rd glass sheet). Moreover, Figure 6 shows that the coincidence effect which occurs at 2000 Hz significantly decreases the sound insulation of the test specimen (up to 10 dB). Low values of sound reduction index below 400 Hz are caused by resonant effects of the system mass–gas–mass–gas–mass.

From these charts (Figures 7–9) it can be stated that triple IGU of A-type specimens in combination with different thicknesses gas cavities and glass sheets enables better sound insulation when the gas cavity and glass sheets are of the same thickness. The use of acoustic PVB interlayer (sound reduction film) instead of ordinary PVB interlayer in laminated glass achieved up to 10 dB better sound insulation in 400–5000 Hz frequency range. It should be mentioned that acoustic PVB interlayer is more elastic compared with the ordinary PVB interlayer.
Figures 7 and 8 show that using B- and C-type specimens with two laminated glass sheets provides better sound insulation up to 6 dB in the frequency range below 315 Hz. As can be seen from Figures 7 and 8, the place of laminated glass in the IGU only slightly influences (increment < 5 dB) sound insulation of specimens. The use of gas cavities and glass sheets of different thickness in B- and C-type specimens do not provide better sound insulation than when they are of the same thickness. However, increasing the thickness of the IGU from 56 up to 64 mm (it is increasing thickness of glass sheet and air gap), a better sound insulation up to 8 dB is noticed in the analysed frequency range due to mass increment (mass law).
The comparison of frequency dependence of the sound reduction index (R) of first and second group specimens (frame cavities of structural glazing are empty and partially filled with gypsum fibreboard) is provided in Figures 10 and 11.

It can be seen from Figure 10 that little improvement of sound insulation of specimens with triple IGU (B type) in a partially filled with gypsum fibreboard frame is found at 400–5000 Hz and no improvement is obtained below 400 Hz (compared with the same specimen in a frame without infill). Improvement is up to 3 dB in 400–3150 Hz frequency range for specimens FF2-3/FF2-4 compared with F2-3/F2-4 and improvement is up to 3–4 dB for specimen FF2-5 compared with F2-5. This shows that adding mass to the frame of structural glazing only slightly increases sound insulation.

Little improvement is notable (Figure 11) at 4000–5000 Hz and no improvement is seen at other frequencies of C-type specimens with triple IGU and the partially filled with gypsum fibreboard frame compared with the same specimens with empty frame. The improvement is up to 2 dB comparing specimen FF3-1 with F3-1 and up to 3 dB comparing specimen FF3-2 with F3-2 one. The filling of the material into the frame cavity adds additional mass but it has no significant influence on sound insulation of the façade element since the area of the frame is small compared with area of the IGU (0.32 m2 and 1.56 m2, respectively).
The comparison of sound insulation of the same specimen with an empty frame and partially filled frame using different materials is provided in Figure 12.

As can be seen from Figure 12, even placing materials with very different densities in the cavities of the frame (see Section 2), creating a different mass of the whole frame, does not have any influence. The character of the curves is also similar. This shows that the sound insulation of a façade element mainly depends on the characteristics of used IGU but not the frame.
3.2. Weighted Sound Reduction Index
The comparison between single-number quantities and weighted sound reduction index (Rw) values including uncertainty is provided in Figure 13.

It can be seen from Figure 13 that the weighted sound reduction index (Rw) value varies from 42 dB to 46 dB (difference 4 dB) for A-type specimens; from 43 dB to 44 dB (1 dB difference) for B-type specimens; and the Rw value is 44 dB for C-type specimens. Thus, it can be stated that using for façade glazing triple IGU with one internal laminated glass and two ordinary glass sheets, a larger variation in sound insulation is notable compared with IGU of two laminated and one ordinary glass sheets. Moreover, it should be noted that when using two laminated glass sheets and one ordinary glass sheet, it does not imply better sound insulation compared with one laminated glass sheet and two ordinary glass sheets.
This comparison shows that the highest weighted sound reduction index (Rw) value is obtained by increasing the mass of the external glass sheet (using thicker ordinary or laminated glass), and increasing the thickness of the gas cavity. Comparing the Rw values of F2-1 and F2-2 with the values of F3-1 and F3-2 also shows that the influence of the inner and external glass sheets on the weighted sound reduction index (Rw) value of the entire structural glazing is close to similar.
The better sound insulation performance of the façade elements is provided by the Rw + Ctr values which show sufficient attenuation of traffic noise levels. The comparisons between Rw values with spectrum adaption terms (Rw + C and Rw + Ctr) are provided in Figures 14 and 15.


Figure 14 shows that for A-type specimens, Rw + C is from 40 dB to 45 dB (decrement is only 1–2 dB); for B-type specimens, from 41 dB to 42 dB (decrement 2 dB); for C-type specimens, 43 dB (decrement 1 dB). Figure 15 shows that for A-type specimens Rw + Ctr is from 36 dB to 43 dB (decrement 3–6 dB); for B-type specimens, from 38 dB to 39 dB (decrement 4–6 dB); for C-type specimens 40 dB (decrement 4 dB). These values show that living and traffic noise is best suppressed by thick outer glass and a thicker gas cavity (F1- 4 and F1-5). Comparing the results of B-type specimens once again shows that increasing the glass thickness and reducing gas cavity thickness is irrational.
The comparison of weighted sound reduction index (Rw) values without and with spectrum adaption terms (C and Ctr) of IGU in empty and in partially filled frame is provided in Figure 16.
The research shows that adding gypsum fibreboard inside the frame increases sound insulation for 1–2 dB compared with the empty frame due to the small area of frame compared with the area of IGU.
In Figure 17, a comparison of sound insulation values Rw and Rw + C and Rw + Ctr of the same IGU in frames partially filled with different materials (see Table 3) is provided.
The research shows that filling the frame with gypsum plasterboard or gypsum fibreboard or steel does not influence the single-number quantity and weighted sound reduction value in this case.


4. Discussion
After analyses of the sound reduction index values of the specimens, it was found that the use of a sound-reducing film in internal laminated glass increases the value of the sound reduction index to 5–6 dB in the range of higher frequencies (2000–5000 Hz), but only slightly in the range of low frequencies (100–300 Hz). However, the influence of the sound reduction film in an external glass sheet on the sound insulation of glass units is not significant when this type of film is already used in the internal laminated glass. Increasing the thickness of the gas cavity has a significantly greater influence than increasing the thickness of the laminated glass sheet; in the low frequency range it is about 8 dB, in the high frequency range it is about 6 dB.
Moreover, increasing the thickness of the gas cavity improves the sound insulation performance of the glass unit much more than the use of inner laminated glass. Increasing the thickness of the gas cavity is much more rational than using additional or thicker laminated glass, as it only slightly increases the weight and cost of the insulated glass unit. It can also be seen that in the range of 300–800 Hz, the values of the sound reduction index of façade elements with a triple glass unit, the inner glass of which is laminated, do not depend significantly on the thickness of the glasses and the gas cavity. Installation of external laminated glass instead of the ordinary 6 mm glass improves the properties of the structural glazing at low frequencies, in the range 100–300 Hz it is about 6 dB, but in the range of higher frequencies (700–1500 Hz) it reduces about 6 dB.
Structural glazing with triple IGU in combination with different thicknesses gas cavities and glass sheets enables to obtain better sound insulation than when the gas cavities and glass sheets are of the same thickness. The filling of the material into the frame cavity adds additional mass but it has no significant influence on sound insulation of the façade element since the area of the frame is small compared with area of the IGU. This shows that the sound insulation of a façade element mainly depends on the characteristics of the used IGU. The usage of two laminated glass sheets and one ordinary glass sheet does not imply better sound insulation compared with one laminated glass sheet and two ordinary glass sheets. The highest weighted sound reduction index (Rw) value is obtained by increasing the mass of the external glass sheet (using thicker ordinary or laminated glass), and increasing the thickness of the gas cavity. This also applies to transport noise insulation.
It should be noted that the values of sound insulation indicators of specimens with triple IGU obtained during this study cannot be directly applied to the façade of an analogous structure, since the sound insulation of a real façade depends on the dimensions of the mounting frame and the properties of the structure to which the glazed façade is attached. The sound insulation efficiency of the glazed façade is most accurately determined by performing measurements of the façade layout.
5. Conclusions
In this research, the structural sealed façade structure with triple IGU was investigated and the effect of the thickness of ordinary and laminated glasses, their position in the IGU, the presence of sound reduction film in laminated glass, the thickness of the gas cavities, and the mass of the structural frame on the sound insulation level of structural glazing was determined. The analysis of research results showed that:
- When triple insulating glass units (IGUs) with inner laminated glass are used for energy efficient and safety structural glazing, the highest values of sound insulation indicators are achieved not by using more laminated glass sheets, but by increasing the thickness of the external ordinary glass and gas cavities;
- When structural glazing has safety requirements on both sides and external and internal laminated glasses should be installed, the use of a second sound reduction film does not improve the sound insulation properties of the structural glazing;
- Use of inner laminated glass sheet in triple-glazed units has the least effect on the sound insulation level of structural glazing, so it is not to be used;
- Increasing the mass of the structural glazing frame by filling the frame cavities with a material of any density does not have a significant effect on the sound insulation of the glazed façade since most of the noise passes through the IGU;
- The sound insulation of the structural glazing depends on the range of noise frequencies, so when choosing the glazing unit, the dominant noise source must be considered.
These research results can be useful for designers and architects who design façade structure for protection of premises from environmental noise, especially knowing the origin of the sound (dominant frequency). The results of the research can also be used by manufacturers of materials and elements for glazed façades, choosing the most rational solutions. Since this research is one of the first studies of the acoustic properties of structural elements with triple IGU, its results are not comprehensive and widely applicable, so the research must be extended. In the future, we plan to perform similar research with the increasingly popular wooden structural frames and various ways of attaching the triple IGU to the structural frame.
Author Contributions: Conceptualization, K.M. and R.B.; methodology, V.B.; validation, K.M., V.B. and K.B.; formal analysis, K.M. and V.B.; investigation, K.M.; resources, K.B.; writing—original draft preparation, K.M.; writing—review and editing, R.B. and V.B. All authors have read and agreed to the published version of the manuscript.
Funding: This research received no external funding.
Institutional Review Board Statement: Not applicable.
Informed Consent Statement: Not applicable.
Acknowledgments: This experimental study was performed with the contribution of façade manufacture JSC STATICUS Vilnius, Lithuania.
Conflicts of Interest: All authors hereby declare that they have no conflict of interest whatsoever. They declare that they do not have any commercial or associative interest that represent a conflict of interest in connection with the work submitted.
References
1. Silva, L.; Oliveira, M.; Silva, J. Urban form indicators as proxy on the noise exposure of buildings. Appl. Acoust. 2014, 76, 366–376, https://doi.org/10.1016/j.apacoust.2013.07.027.
2. Lenchine, V.V. Assessment of amplitude modulation in environmental noise measurements. Appl. Acoust. 2016, 104, 152–157, https://doi.org/10.1016/j.apacoust.2015.11.009.
3. Zaporozhets, O.; Fiks, B.; Jagniatinskis, A.; Tokarev, V.; Karpenko, S.; Mickaitis, M. Indoor noise A-level assessment related to the environmental noise spectrum on the building facade. Appl. Acoust. 2021, 185, 108380, https://doi.org/10.1016/j.apacoust.2021.108380.
4. Keränen, J.; Hakala, J.; Hongisto, V. The sound insulation of façades at frequencies 5–5000 Hz. Build. Environ. 2019, 156, 12–20, https://doi.org/10.1016/j.buildenv.2019.03.061.
5. Tombolato, A.; Bonomini, F.; Di Bella, A. Methodology for the evaluation of low-frequency environmental noise: A case-study. Appl. Acoust. 2021, 187, 108517, https://doi.org/10.1016/j.apacoust.2021.108517.
6. Ryu, J.; Song, H. Effect of building façade on indoor transportation noise annoyance in terms of frequency spectrum and expectation for sound insulation. Appl. Acoust. 2019, 152, 21–30, https://doi.org/10.1016/j.apacoust.2019.03.020.
7. Soussi, C.; Aucejo, M.; Larbi, W.; Deü, J.-F. Numerical analyses of the sound transmission at low frequencies of a calibrated Insulating Glazing Unit. Appl. Acoust. 2021, 179, 108065, https://doi.org/10.1016/j.apacoust.2021.108065.
8. Li, A.; Martino, E.; Mansour, A.; Bentley, R. Environmental Noise Exposure and Mental Health: Evidence From a PopulationBased Longitudinal Study. Am. J. Prev. Med. 2022, 63, e39–e48, https://doi.org/10.1016/j.amepre.2022.02.020.
9. EEA Report. Environmental Noise in Europe—2020; European Environment Agency: Copenhagen, Denmark, 2019; ISSN 1977–8449.
10. Kurra, S.; Dal, L. Sound insulation design by using noise maps. Build. Environ. 2012, 49, 291–303, https://doi.org/10.1016/j.buildenv.2011.07.006.
11. Caniato, M. Sound insulation of complex façades: A complete study combining different numerical approaches. Appl. Acoust. 2020, 169, 107484, https://doi.org/10.1016/j.apacoust.2020.107484.
12. Naticchia, B.; Carbonari, A. Feasibility analysis of an active technology to improve acoustic comfort in buildings. Build. Environ. 2007, 42, 2785–2796, https://doi.org/10.1016/j.buildenv.2006.07.040.
13. Tadeu, A.J.; Mateus, D. Sound transmission through single, double and triple glazing. Experimental evaluation. Appl. Acoust. 2001, 62, 307–325, https://doi.org/10.1016/s0003-682x(00)00032-3.
14. Gulia, P.; Gupta, A. Sound attenuation in triple panel using locally resonant sonic crystal and porous material. Appl. Acoust. 2019, 156, 113–119, https://doi.org/10.1016/j.apacoust.2019.07.012.
15. LST EN ISO 10140-1:2010; Acoustics—laboratory measurement of sound insulation of building elements—Part 1: Application rules for specific products; (ISO 10140-1:2010); ISO: Geneva, Switzerland, 2010.
16. LST EN ISO 10140-2:2010; Acoustics—laboratory measurement of sound insulation of building elements—Part 2: Measurement of airborne sound insulation; (ISO 10140-2:2010); ISO: Geneva, Switzerland, 2010.
17. LST EN ISO 10140-4:2010; Acoustics—laboratory measurement of sound insulation of building elements—Part 4: Measurement procedures and requirements; (ISO 10140-4:2010); ISO: Geneva, Switzerland, 2010.
18. LST EN ISO 10140-5:2010; Acoustics—laboratory measurement of sound insulation of building elements—Part 5: Requirements for test facilities and equipment; (ISO 10140-5:2010); ISO: Geneva, Switzerland, 2010.
19. LST EN ISO 717–1:2013; Acoustics—rating of sound insulation in buildings and of building elements—Part 1: Airborne sound insulation; (ISO 717–1:2013); ISO: Geneva, Switzerland, 2013.
20. Larson Davis Noise Spectra Meter–Generator Parameters. Available online: http://granat-e.ru/larson_davis_2800_2900.html (accessed on 1 August 2022).
21. Larson Davis Microphone with Initial Microphone Preamplifier Parameters. Available online: https://cdn.thomasnet.com/ccp/10052672/109083.pdf. (accessed on 1 August 2022).
22. Nordic Metrology Science, Dariaus and Girėno str. 23, Vilnius, Lithuania. Available online: https://nordicmetrology.com/ (accessed on 1 August 2021).









Comments
It really helpful to me especially the pictures help me Alot!