Article Information
- Digital Object Identifier (DOI): 10.47982/cgc.9. 473
- Published by Challenging Glass, on behalf of the author(s), at Stichting OpenAccess.
- Published as part of the peer-reviewed Challenging Glass Conference Proceedings, Volume 9, June 2024, 10.47982/cgc.9
- Editors: Christian Louter, Freek Bos & Jan Belis
- This work is licensed under a Creative Commons Attribution 4.0 International (CC BY 4.0) license.
- Copyright © 2024 with the author(s)
Authors:
- Fred Veer
- Telesilla Bristogianni

Abstract
Microscopy has been an indispensable tool for science since the 17th century. It has been used to study glass fractures for decades. The main problem with conventional microscopy is that you can only see a complete image if all aspects of the image are in the same geometrical plane of focus. Digital microscopy is a critical advance since it can combine information in different geometrical planes into a single image. With a transparent material such as glass this opens up new perspectives in that by using the right combination of transmission and reflective lighting both internal defects and complicated 3D surface defects can be imaged. In the field of float glass this allows for the study of edge and surface defects pre-fracture and the damage visible post-fracture. In the field of cast glass this allows for studying the -often complex- network of defects in the bulk. The ability to view and study such internal defects supports research efforts towards the characterization and application of recycled glass. The paper will show the critical aspect of using the right lighting and lenses and the settings needed to obtain high quality images of complex 3D damage. This will be demonstrated based on the microscopic analysis of multiple float and cast glass specimens tested in 4 point bending at the TU Delft Glass lab. Using proper lighting and technique provides a new insight into the fracture processes of glass.
1. Introduction
Microscopy and glass technology are closely interrelated historically. The pioneering work by the Dutch scientists Anthonie van Leeuwenhoek and Christiaan Huygens in the 17th century glass, based on Hudde’s single lens microscope and Spinoza’s grinding and polishing methods that led to clearer glass (Zuidervaart & Anderson 2015) allowed for major progress in the field of optics and lens production making possible the first microscopes with magnifications sufficient to study biological cells. This led to major advances in Biology and medicine.
In the 18th century the discipline of Petrography was developed by Abraham Gottlob Werner, looking at thin sections of rock using transmitted light microscopy. This discipline started to flourish in the 19thcentury as increased industrialisation required an increase in mining which required the identification of ores, making it currently a major sub-discipline of the field of geology (Ospovat, 1960).
Reflected light microscopy was not used significantly in materials research until Adolf Martens invented the discipline of Metallography using reflected light microscopes to study polished and etched metal samples to determine metallic structures, the Martensite structure in hardened steel being his discovery (Samuels, 1999).
Fractography, the study of fracture surface using reflected light microscopy, was developed in 1944 by Carl A. Zapffe to determine the cause of failure of engineering structures (Hull, 1999).
Fractography was later applied to broken glass to study the failure process by Doremus and others, although the earliest observations of glass fractured surfaces and of fracture mirrors date back to 1894 to the work of Brodmann (Quinn, 2012).
Studying glass in a microscope is not easy. To identify a feature, the feature must interact with light in such a way that it becomes visible. In float glass internal defects are avoided as much as possible during production, so surface defects from edge post-processing or handling are the main strength reducing factors. Molnar (2011) has studied defects in float glass using conventional microscopy.
The problem of conventional microscopy is that you can only focus on a single plane. Stereo microscopes allow for a 3D study of surfaces but the images cannot be photographed in 3D. Digital microscopy allows photos to be made in several planes and the in focus parts of those photos to be combined into single images allowing 3D objects to be imaged. Early experiments with this by van der Velde et al. (2012) showed the potential of digital microscopy for glass fractography.
Bristogianni (2022) used digital microscopy to study the internal defects in cast glass and the resultant fractography. This work demonstrated the significant added value of digital microscopy in glass research. Based on this and subsequent research, critical aspects of digital microscopy of glass have been determined, becoming the subject of this paper.
2. Light and the digital microscope
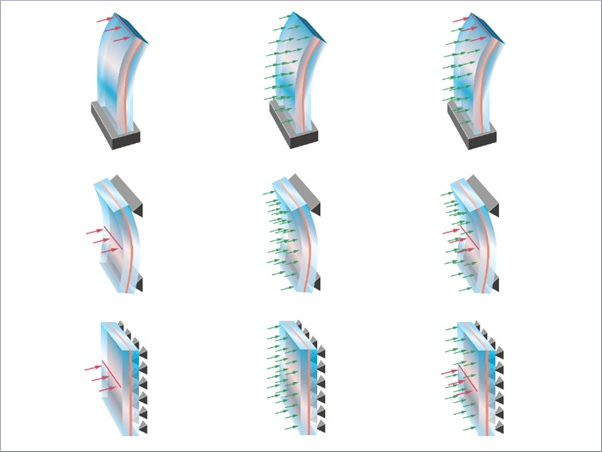
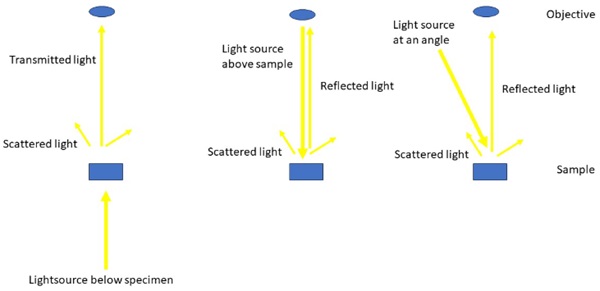
Microscopy depends on the interaction of light and a substrate. How the light is applied is critical for the view of the substrate that is generated. Basically the way the light is applied can be divided into:
- Light from the top with the upwards reflection being studied.
- Light applied at an angle with the upwards reflection being studied.
- Light being sent through the substrate with the transmitted light being studied.
The light can be coloured if filters are used.
The light going into the objective can be polarised using a filter, the light going into the substrate from the bottom can be polarised. If both polarisers are used, cross polarisation can be used to check for stress fields in the glass.
Figure 1 illustrates the ways the substrate can be lighted. Reflected and transmitted light can also be combined with glass, balancing the amounts of each type of light to enhance the image of a feature on or in the substrate.
3. Imaging with digital microscopy
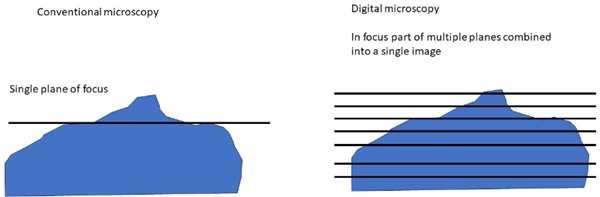
In conventional microscopy the image as seen through the objective is made by focussing on a single geometrical plane. This plane is at right angles to the axis between the centre of the objective and the object that is looked at. So a flat object can be imaged easily. A three dimensional object can not because the object by definition is in several possible planes of focus. A stereo microscope has one lens for each eye and thus allows for depth perception, but is limited to low magnifications. Additionally, as a camera can only be connected to a single lens, the 3D images cannot be photographed.
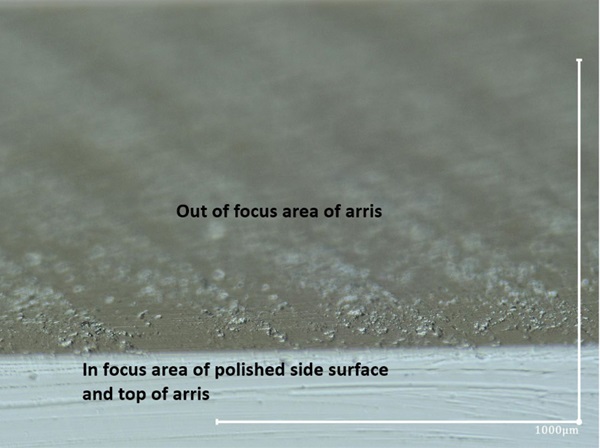
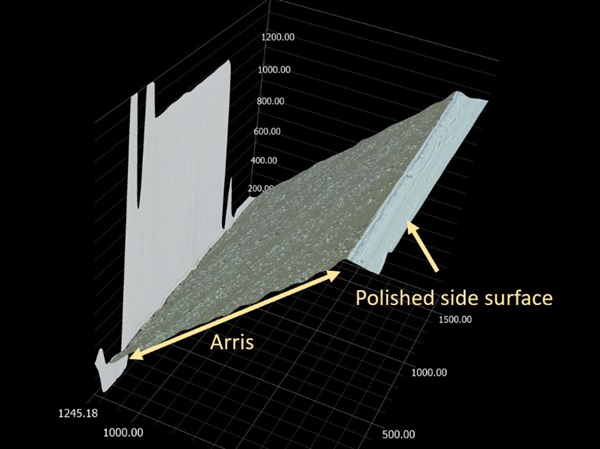
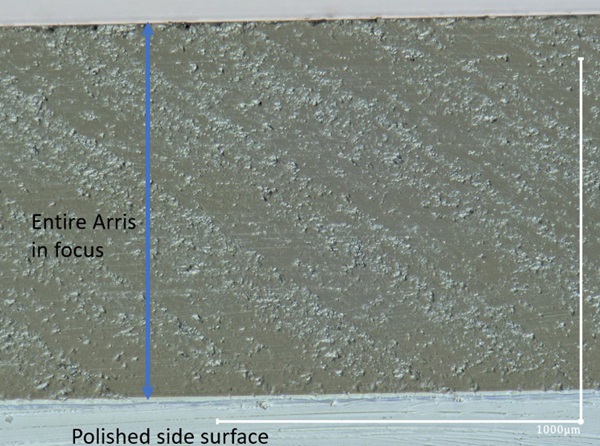
Digital microscopy solves this problem by making a series of photos at different heights using a computer controlled Z axis movement. The computer takes the in focus parts of each photo and combines these into a digital 3D image. The principle is shown in figure 2. Figure 3 shows the edge of an arris with only the edge in focus. Figure 4 shows a 3D picture of the entire arris. Figure 5 shows a 2D picture that shows the information in figure 4 in a single flat image. These illustrate the advantage of digital microscopy.
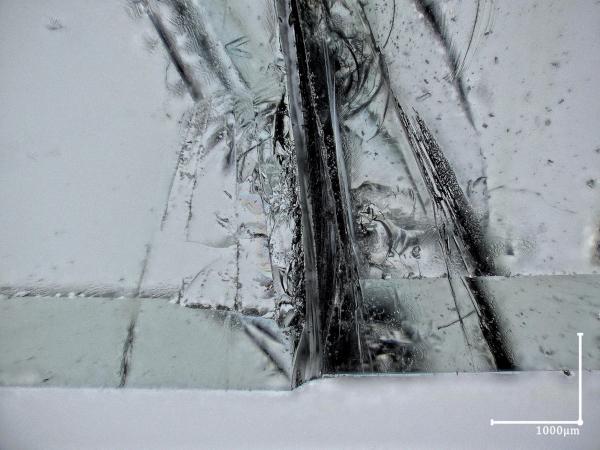
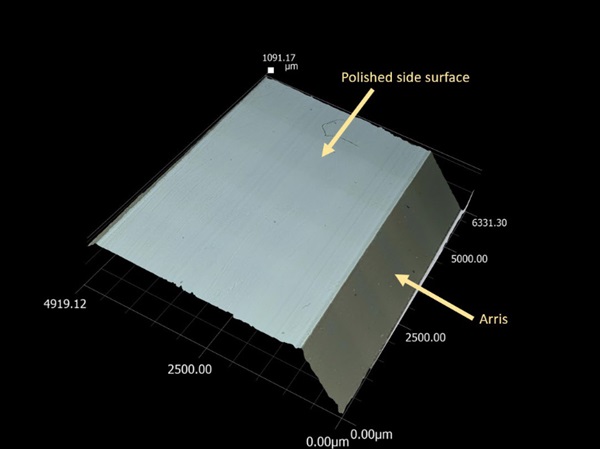
Additionally if the digital microscope has a computer controlled X,Y stage in addition to the Z axis movement the object can be moved in the X Y plane and a series of images can be made which can be combined into a single large digital 3D image, the computer combining the different images in the X Y Z directions. Thus digital microscopy allows for the imaging of a complete object in 3D at high magnification. Figure 6 shows a combined picture showing a large amount of polished edge surface and arris in detail, magnification 200X transmitted lighting.
The price for this is the cost of the system, a very powerful computer is required and time, as hundreds of images have to be made to make a single large image and storage. A single photo can easily be 100 Mb in size.
Modern digital microscopes, such as the Keyence VHX 7000 used by the authors for the images of this paper, have a stage that can move in the X-Y and Z directions; bottom lighting that allows for transmitted light and top lighting that allows for axial reflected light and angled reflected light. Top and bottom lighting can be used simultaneously with the light intensity from each source adjustable to provide a balanced lighting situation.
4. Float glass
4.1. Internal defects
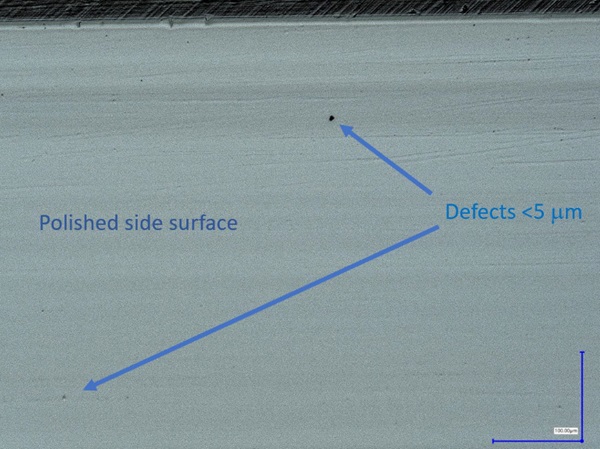
Float glass is a material where in the production process all visible defects are avoided if possible. Although some exist, Molnar (2011), modern float glass produced with line scanners for quality control is effectively free from internal defects larger than 250 μm and a 100 μm for thin glass lines for displays. Internal defects are very difficult to find because they are very small and randomly placed in the glass. Occasionally when checking a surface some traces of internal defects are found. An example is shown in figure 7 which shows a 5 μm defect on a polished surface which most likely is an internal defect opened up by the edge processing.
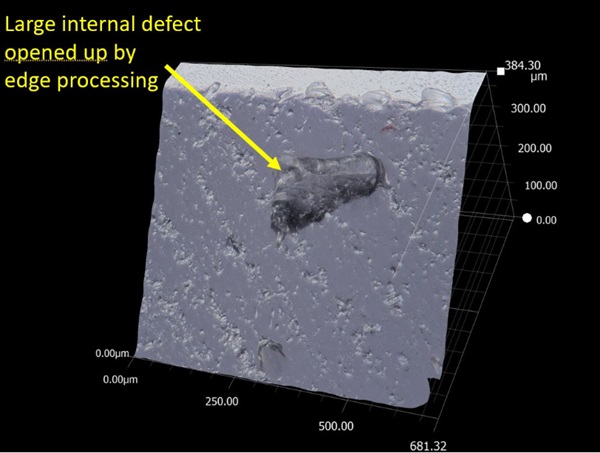
Figure 8 shows a large defect on the arris of a specimen. Considering the shape this is most likely the site of an inclusion that was opened up by the edge processing. It should be noted that these defects are quite rare in the glass which was investigated. In 100 Poly V polished glass specimens, with dimensions of 250X50X6 mm, only one defect like that in figure 8 was found.
4.2. Quality control of surfaces
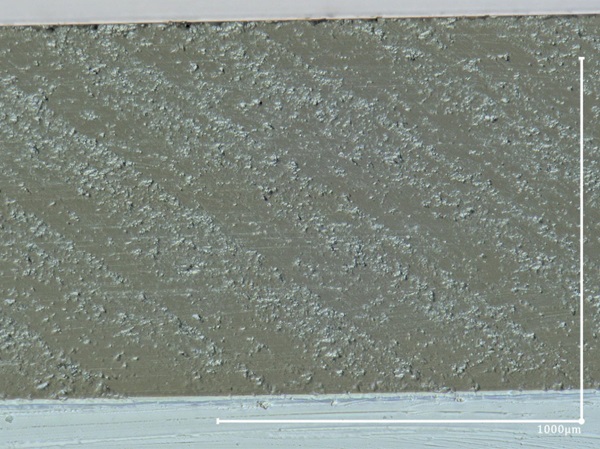
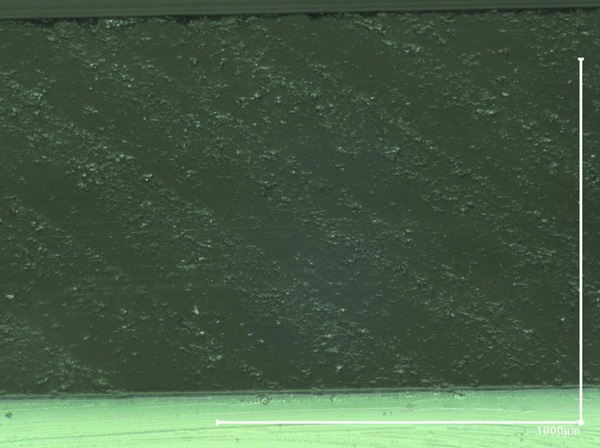
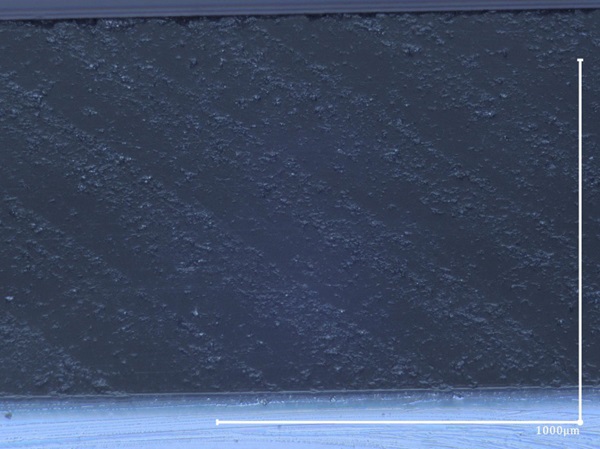
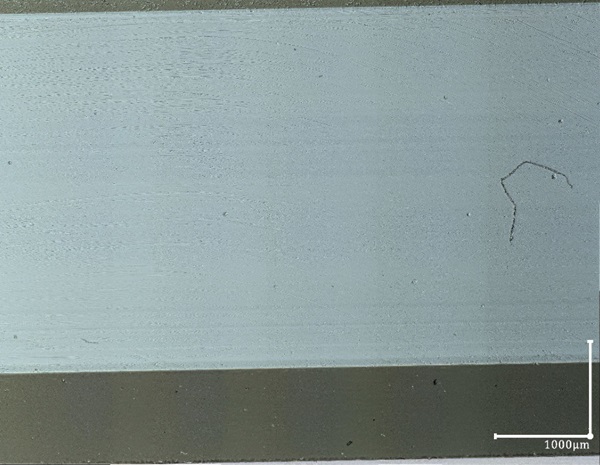
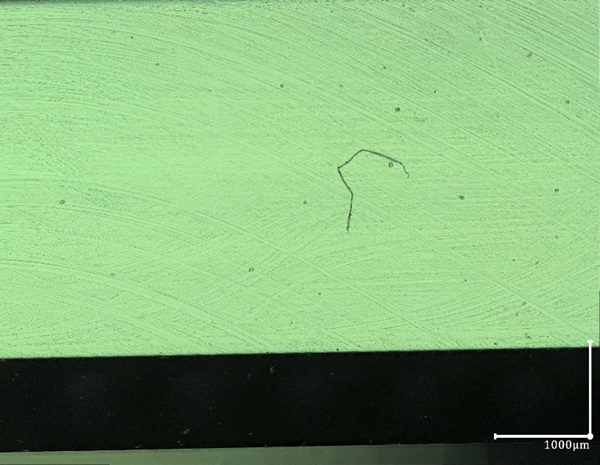
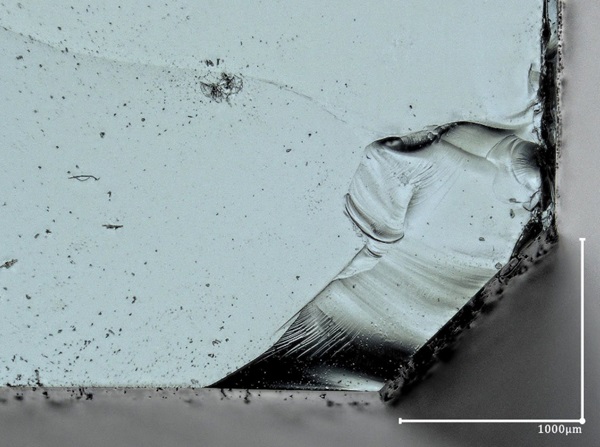
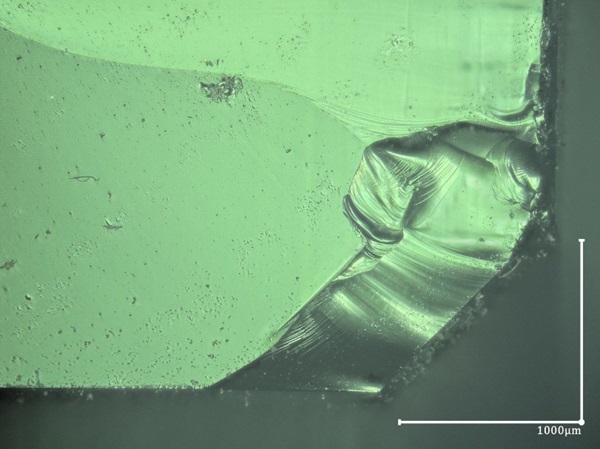
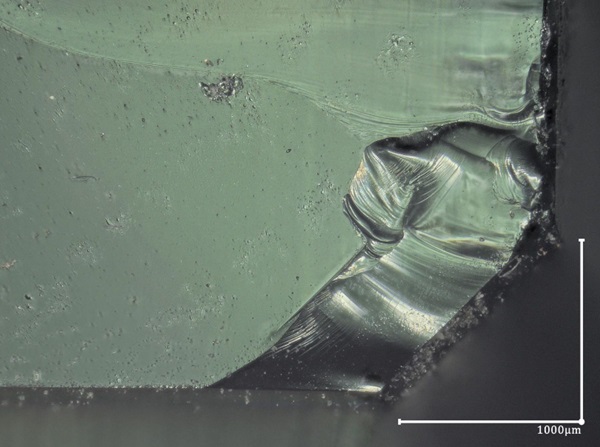
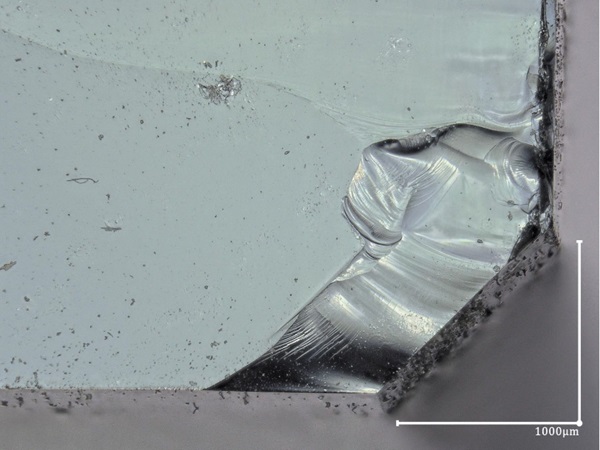
To look at a surface it is critical to use the right lighting. Figures 9, 10 and 11 show the same arris, which is at a 45°angle to the axis of the microscope. All photos are at the same magnification but using transmitted, reflected and angled reflected light respectively. All photos were made in 3D but processed to a 2D image for comparison. Although all three photos show the same thing, actually the transmitted lighting photo in figure 9 gives the clearest image. This is not the same for a surface perpendicular to the axis of the microscope. Figure 12, 13 show the same polished side surface but using transmitted and reflected light. Although figure 12 shows the small pits in the surface quite well, figure 13 shows these and the polishing marks much better. The interpretation of surface quality is thus strongly dependent on the lighting used.
4.3. Fracture initiation sites
The advantage of digital photography is that it allows for 3D imaging. So accurate imaging of the actual site where fracture started is possible. A series of annealed poly V polished glass test specimens were tested in out of plane 4 point bending. These were taped in transparent self-adhesive tape on the bottom and top surface to keep the fragments together and to allow study of the actual initiation point of fracture.
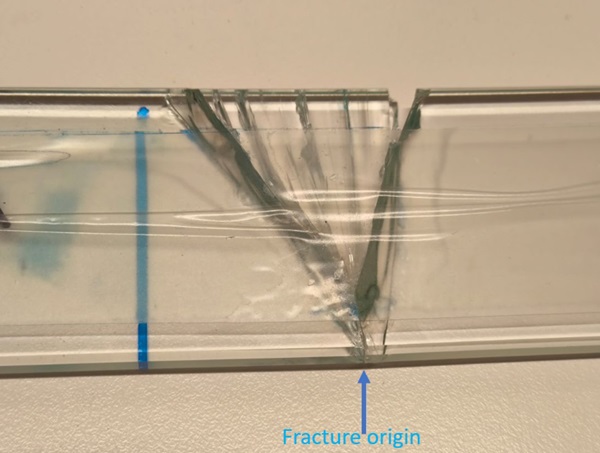
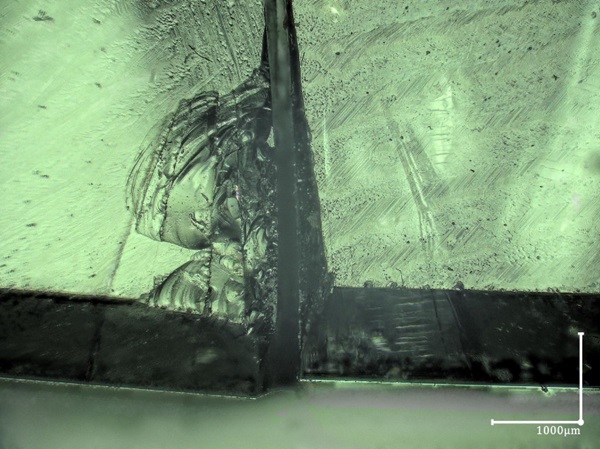
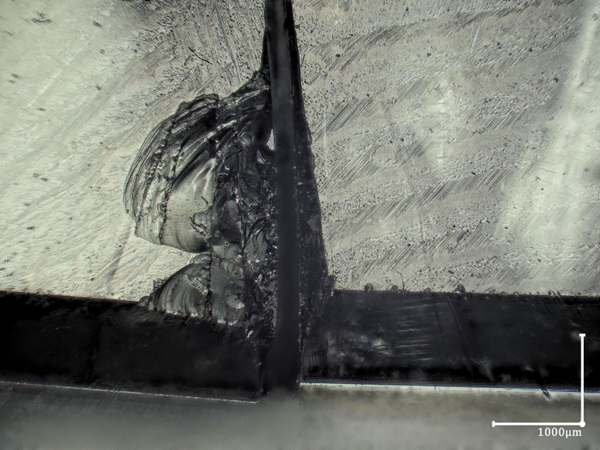
Glass fracture is a violent event. Energy cannot be absorbed by plasticity or visco-elastic flow, so a significant amount of energy is distributed into crack branching and spallation. So annealed glass that failed at high stress does not show a simple crack geometry. Figure 14 shows a macro-photo of a failed specimen. The fracture initiation point is the point of the V at the bottom of the specimen. Although it is clear from the crack on which the fracture started, finding the actual point where failure started is not so easy. Figure 15 shows a 2D image reduced from a 3D image of the surface where failure started using transmitted light. Although a lot of features are visible, very little can be concluded from this.
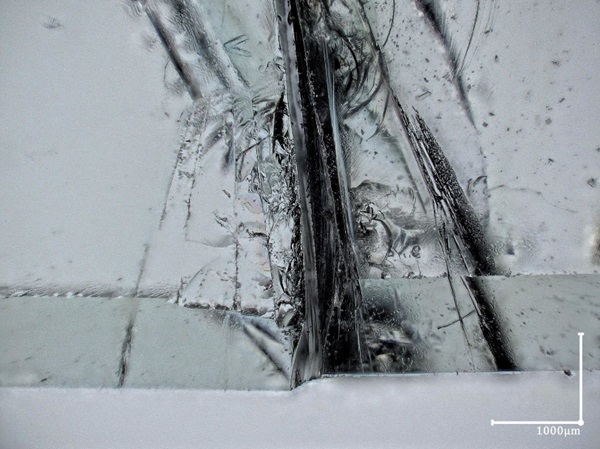
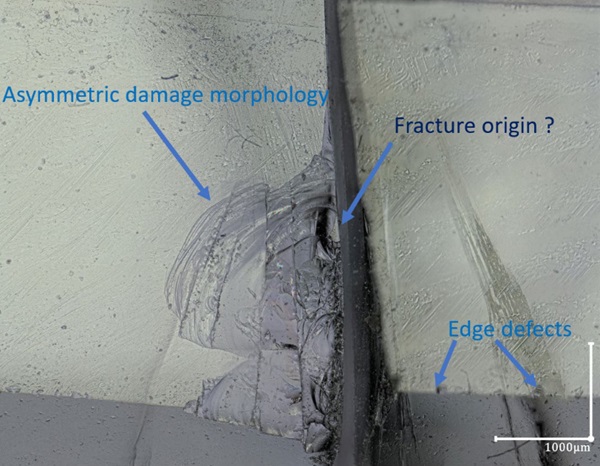
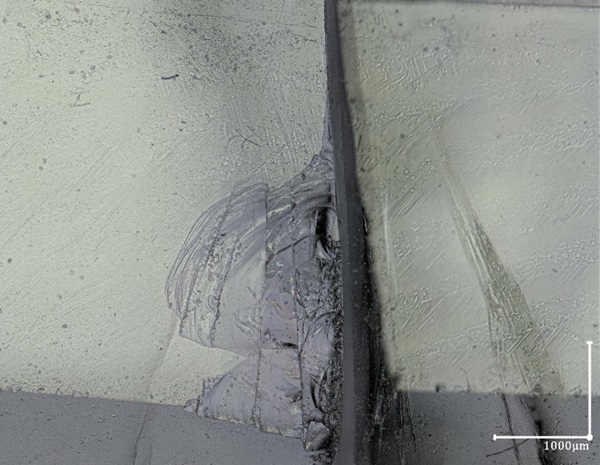
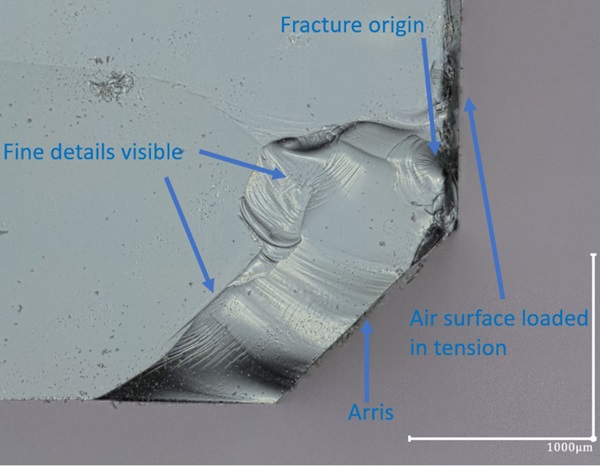
Figure 16 uses reflected light and shows that the actual damage is a-symmetric, only on the left side of the crack (using the orientation of figure 16) is a damage zone visible. Significant spallation has occurred with many small pieces missing. Although some small edge damage at the intersection of the arris and the loaded flat side is visible it is not clear where fracture occurred. In figure 17 the light is angled to better illuminate the non-flat damage zone which does show the roughness better. Figure 18 uses a balanced combination of angled and transmitted light which shows a hole about 2 mm from the arris. This actually could be the origin of the cracking process rather than any defect at the intersection of arris and flat surface. Figure 19 shows the same area, but photographed at higher magnification using the X-Y-Z stage to create a large composite photo 119 Mb in size. In this case this does not provide more information that figure 18, which is 3.3 Mb.
4.4. Fractography
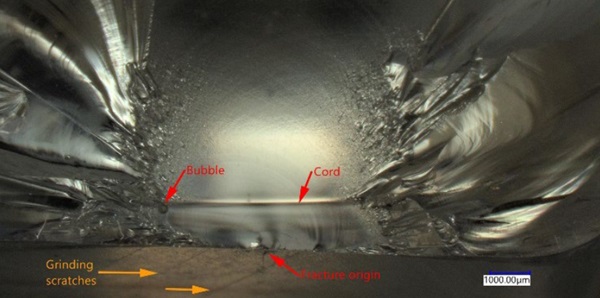
The quality of images of float glass fractography is again dependent on lighting. Figure 20 showing an example of a fracture surface of the same series as the specimen in figure 14 using transmitted lighting. Although a lot of details are visible, the conventional mirror mist hackle pattern is absent. The pattern of radiating rays just above the edge of the arris on the right side of the picture suggesting some event at that location. Using transmitted light, as in conventional fractography, in figure 21 shows the surface details better. Angling the reflected light is not a big improvement as figure 22 shows. However using a balanced combination of transmitted and reflected light as in figure 23 makes a clearer picture. Using this to make a composite X-Y -Z photo at high magnification results in figure 24. This shows a lot of fine detail and the radiating pattern of rays can be assumed to be the fracture origin. This again is a 112 Mb image. The images shown are all from out of plane 4p bend testing. Failure stresses are around 50 MPa so a lot of elastic energy is released at failure. Presumably the low height of the out of plane specimen, the high stress gradient and the large amount of energy released changes the conditions of cracking resulting in a crack pattern that does not conform to the mist mirror hackle pattern.
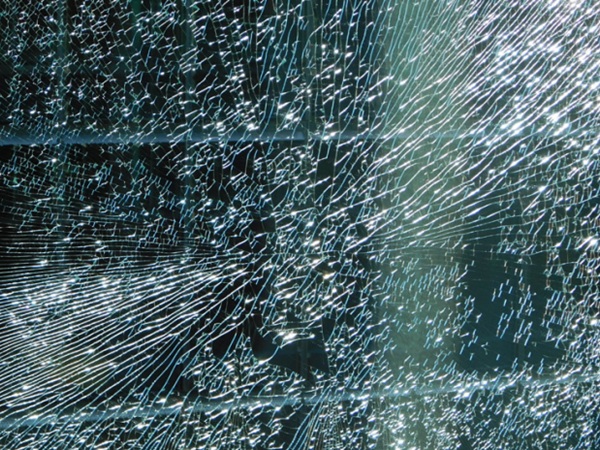
In plane 4p B testing does provide a classical mist mirror hackle pattern as is shown in figure 25. This was a specimen with low failure stress, about 22 MPa, so less elastic energy was released at failure. It does however show the classical fracture morphology.
5. Cast glass
5.1. Internal defects
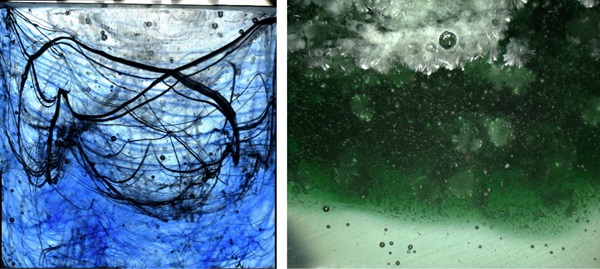
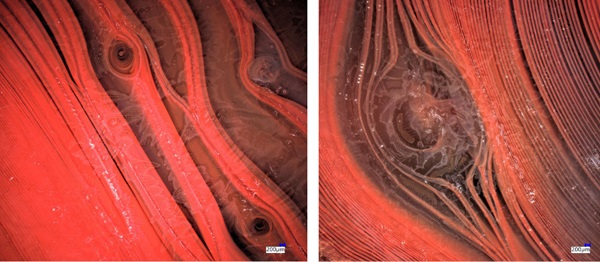
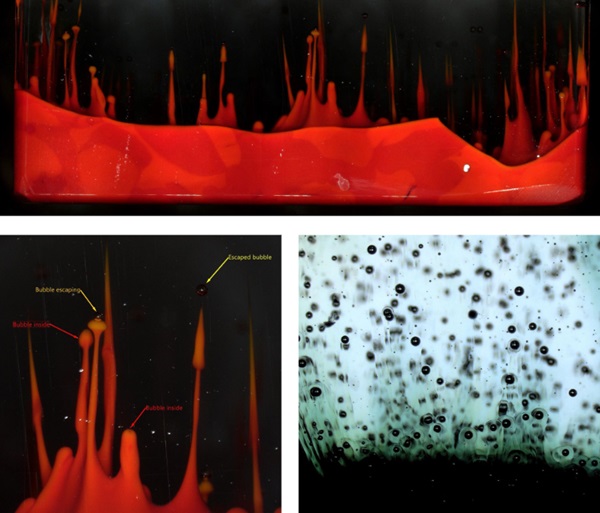
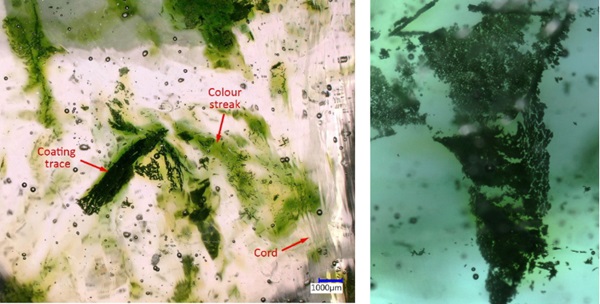
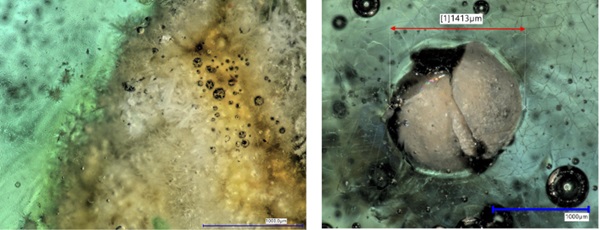
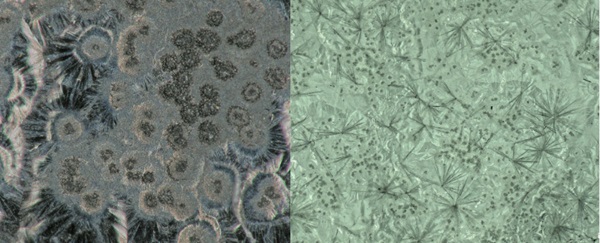
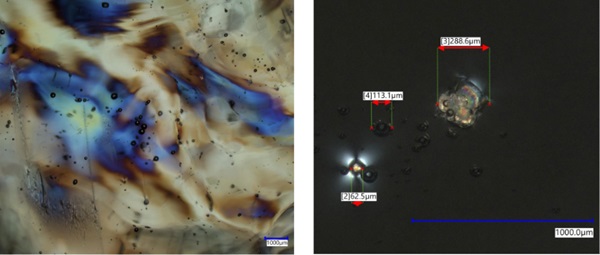
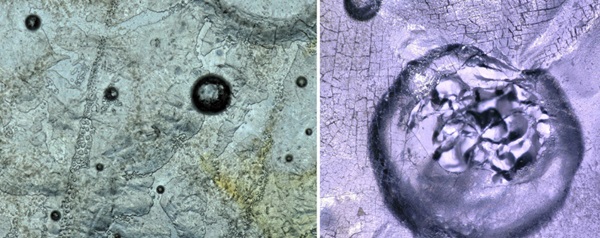
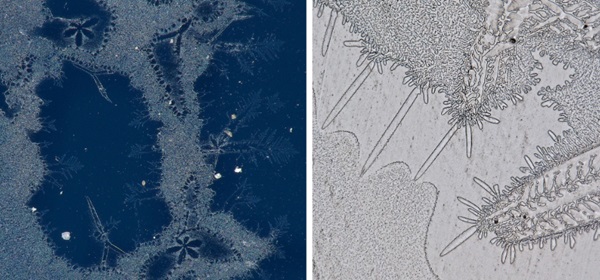
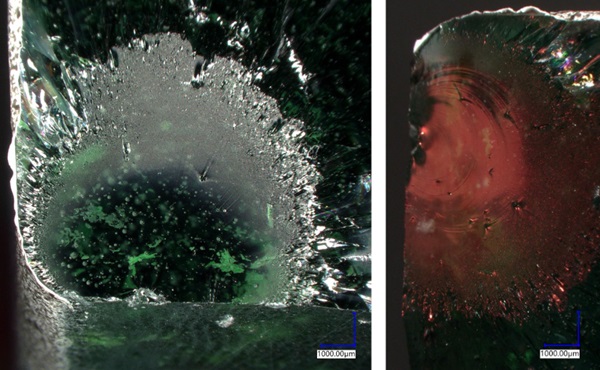
The casting of glass into voluminous objects typically leads to the creation of meso-level structures, composed of one or more types of defects, of glassy, gaseous or crystalline nature (Figure 26). The presence of such defects increases when poor batch quality and homogenisation practices are employed, combined with reduced melting temperatures that increase the melt viscosity. The recycling of contaminated glass waste streams by casting (Bristogianni & Oikonomopoulou, 2023), intensifies the presence of defects, raising questions on their effect on glass strength, which can be answered by studying the bulk of the components with the use of a digital microscope, and performing fractographic analysis on mechanically tested specimens. Below, a selection of examples is provided, focusing on how digital microscopy contributes to the understanding of (i) how meso-level structures are developed (Figures 27-28), (ii) what is the character of interfaces and singularities (Figures 29-31), and (iii) the presence and cause of internal stress (Figure 32). The study of the above aspects reveals information on the role of different strength reducing and stress inducing defects in glass fracture.
5.2. Quality control of surfaces
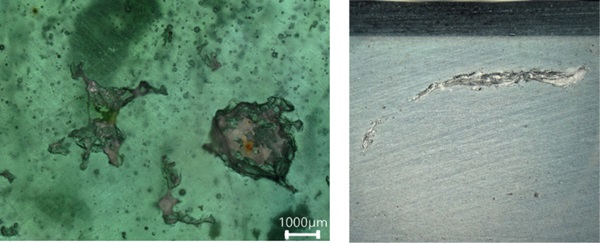
Digital microscopy can greatly contribute to the studying of the surface quality of cast glass samples, revealing information about (i) the morphology of the component’s top surface (glass-air interface, Figures 33-34), (ii) the characteristics of the side and bottom surfaces of the component (glass-mould interface, Figure 35) and (iii) the quality of the post-processing (Figure 35). Pre-screening of specimens prior to mechanical testing can provide an overview of the detected surface flaws, which can be later associated to the predominant flaw causing fracture.
5.3. Fracture initiation sites and fractography
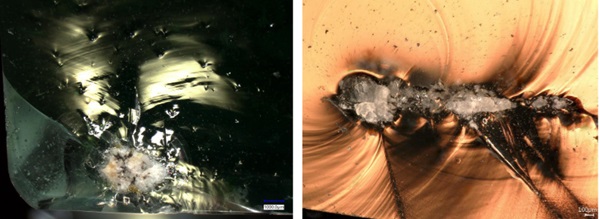
Digital microscopy can be a powerful tool in the fractographic analysis of cast glass specimens, as in-depth compositions can portray the simultaneous acting of multiple defects around the fracture origin(Figures 36-37). Meticulous studying of these fracture sites reveal the type and size of the critical defect(Figure 38), allowing the development of a ranking system among defects, based on their impact on the strength of the glass specimen. This ranking can assist with the prediction of the critical defect leading to fracture during quality control.
The angle of the lighting source can highlight different features, such as mist, or bulk defects (Figure 36). Adjusting the lighting angle can reveal Wallner lines and gull wings, indicating the direction of crack propagation and the interaction of the crack plane with singularities respectively.
6. Discussion
Microscopy of glass basically has 3 elements:
- Finding the subject that you want to make an image of
- Illuminating it in such a way that the boundary of the subject interacts with the light to make it visible
- Making the image of the subject in such a way that conclusions can be drawn about the subject.
The strength of digital microscopy lies in better control of the illumination and of the imaging of the subject.
As the examples show, correct use of lighting is critical to “illuminate” the feature that you want to image. Using the Z-axis to make a series of photo’s at different heights allows for the creation of a 3D image, which can be reduced to a 2 D image with only the in focus parts of the different images being combined into a “flat” photograph. This is convenient to look at the actual fracture or fractography pattern. The ability to image fracture initiation points in 3D, such as in figure 18 allows for more understanding of the processes. In this case the asymmetric nature of the damage implying that the material left and right of the crack is not equal in structure or properties, or that the defect that caused failure was at an angle causing a shallow local surface crack to form which extended sideways to split the specimen. As guideline it is recommended to:
- Use transmitted light to study internal defects, reflected light can create interference due to diffraction effects at the surface.
- Use angled reflected light to study flat surfaces, the angle needs to be chosen in that the angle causes maximum reflection of the object on the surface. In practice the microscopist needs to try different angles to find the optimum angle and on a given surface the angles can be different in different locations.
- At sloped surfaces, such as the arris, use a combination of transmitted light and angled reflected light. Again this requires some experimentation.
As all lighting options on a Keyence VHX 7000 are controlled within the computer system it only takes seconds for an experienced microscopist to find the optimum settings.
The fractographic examples of out of plane 4 point bending of float glass show that the conventional mirror mist hackle pattern was not found in the specimens investigated. There are however indications that some failures started on the flat surface rather than at the intersection of arris and flat surfaced where edge flaws are visible. In this case the photographs of the fracture initiation point in figure 18 and the fractography of figure 24, although of different specimens, suggest the same type of failure origin.
Using correct lighting and imaging allows photographing details which are invisible in conventional microscopy. The classical mist mirror and hackle pattern can be found in certain specimens but seems to be absent in the out of plane 4 p bending tests studied here.
Although the temptation to go for high magnification and combined X-Y -Z imaging is always high, in reality this does not always show up more relevant information as comparing figures 18 and 19 shows. As making the large combined images is very time consuming, up to one hour in some cases, in most cases it is better to find the best lighting combination and make a simple Z-axis combined 3D image, which takes minutes.
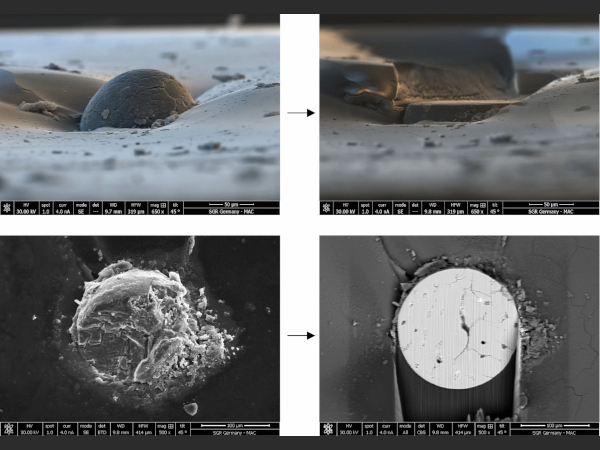
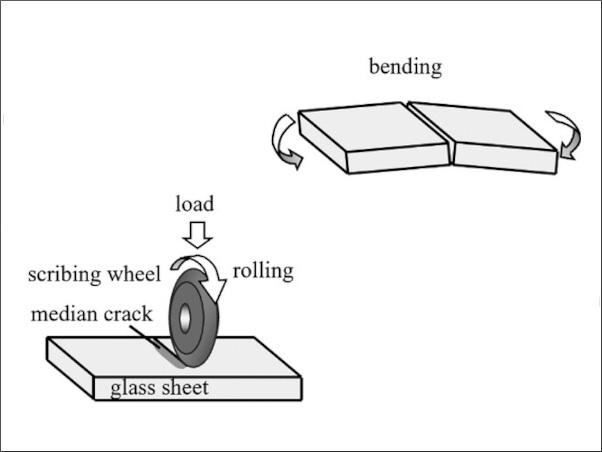
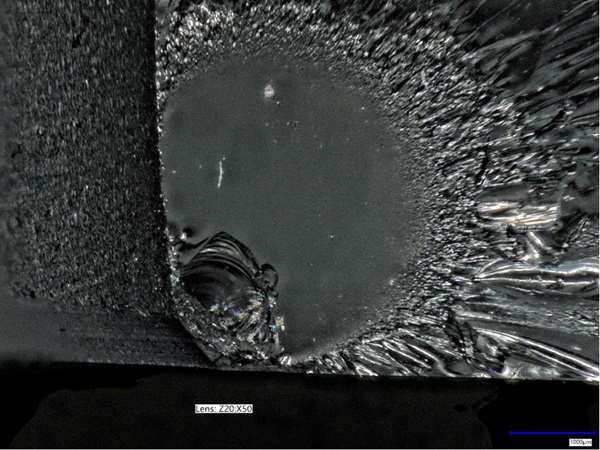
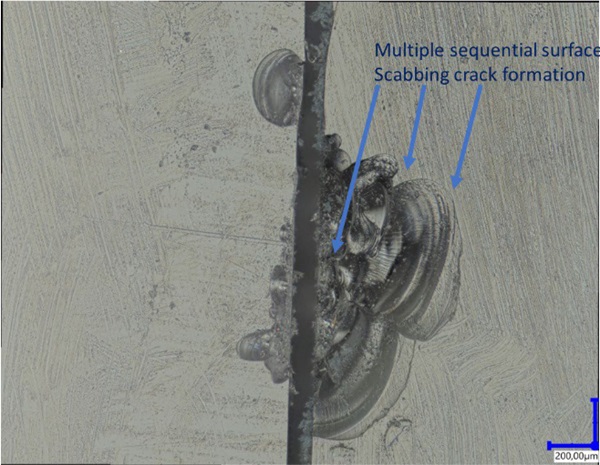
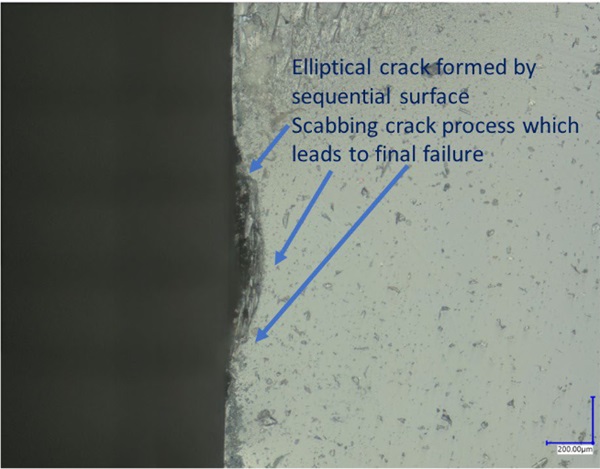
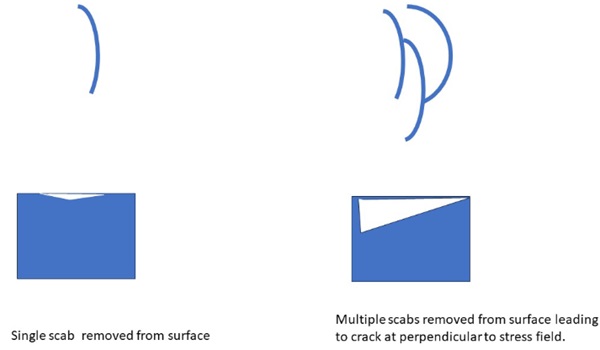
Using these techniques the authors have been able to observe some unusual phenomena in glass fracture. Figure 39 is an example. In a flat four point bending test, fracture originated at the glass surface. Looking at the fracture initiation point it was clear that there was not a single failure, rather a series of scabs sequentially detaching from the surface. This created an elliptical crack which was seen on the fracture surface, shown in figure 40. The elliptical crack was the source of the total failure. Although the total process probably occurred in micro seconds, this still suggests that brittle fracture in glass can be a sequential process, starting from an unknown surface damage, leading to sequential scabbing, forming an actual crack leading to failure. The suggested process is shown in figure 41.
As a final point to discuss, digital microscopy will eventually be an important Quality Control instrument for the glass industry. Although current microscopes are expensive and require skilled operators, in 10 years the price of hardware will have gone down while Artificial Intelligence based software can provide automated QC during production. The major quality step in the float glass industry by introducing line scanners into the float line is a good example how optical technology becomes affordable when automated. Similar control of glass edges using A.I. controlled digital microscopy should be possible in 10 years.
7. Conclusions
In the case of float glass digital microscopy allows for both a good study of damage existing in the glass before testing as well as a 3D detailed study of the actual fracture initiation site which can then be correlated to fractography. The strength of digital microscopy in 3D imaging at high magnification as well as the ability to image large 3D areas thus creates new opportunities to study the fracture process in float glass.
In the case of cast glass, digital microscopy and in-depth imaging facilitates the studying of meso-level structures created by the simultaneous presence of different types of defects, and contributes to the understanding of the mechanisms leading to the creation of these structures. The fractographic analysis of mechanically tested specimens contributes to the identification of the most critical defects, leading to a ranking of severity among the encountered networks of various defects. Such analyses and their correlation to the obtained strength data can be particularly relevant to the efforts of using contaminated waste glass sources as the raw material for casting glass building components.
Acknowledgements
The assistance of Hans van Ginhoven in helping prepare float glass specimens for microscopic study is acknowledged.
References
Bristogianni, T.: Anatomy of cast glass: The effect of casting parameters on the meso-level structure and macro-level structural performance of cast glass components. PhD Thesis, Delft University of Technology (2022)https://repository.tudelft.nl/islandora/search/bristogianni?f%5B0%5D=mods_genre_s%3A%22doctoral%5C%20thesis%22
Bristogianni, T., Oikonomopoulou, F.: Glass up-casting: a review on the current challenges in glass recycling and a novel approach for recycling “as-is” glass waste into volumetric glass components. Glass Structures & Engineering 8(2), 255-302 (2023). doi:10.1007/s40940-022-00206-9
Hull,D.: Fractography, observing, measuring and interpreting fracture surface topography. Cambridge University Press (1999)
Molnár, G., Molnár, L. M., Bojtár, I.: Preparing a comprehensive analysis of the mechanical classification of structural glass. In: Materials Engineering vol 18, 71-81 (2011)
Ospovat, A.M.: Abraham Gottlob Werner and his influence on mineralogy and geology. PhD Thesis, University of Oklahoma (1960)
Quinn, G.D.: A History of the Fractography of Glasses and Ceramics. In: Fractography of Glasses and Ceramics VI, 1- 55 (2012)
Samuels L.E.: Light microscopy of carbon steels, ASM (1999)
van der Velde, O., Copuroglu, O., Veer, F.A.: Looking at glass from a different angle: New insights into fracture patterns through transmitted light microscopy. EMABM 2015: Proceedings of the 15th Euroseminar on Microscopy Applied to Building Materials, Delft, The Netherlands (2015)
Zuidervaart, H., Anderson, D.: Antony van Leeuwenhoek's microscopes and other scientific instruments: new information from the Delft archives. Annals of science 73, 1-32 (2016). doi:10.1080/00033790.2015.112283