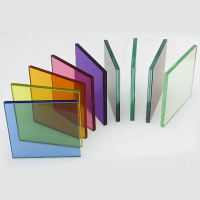
That's why these questions keep coming to my desk (remember I'm an incurable generalist in the façades world): what effect does glass thickness have in the acoustics of a double glass unit? Or what matters more in the acoustical performance of insulated glass: the thickness in a monolithic pane, the effect of lamination or the dimension of the cavity?
Here you will find some graphical answers to these questions. As usual a number of hidden surprises will come out from the data mining.

Let us start by reviewing two concepts that are paramount to measuring glass performance against noise: loudness (in particular sound pressure level, the decibels thing) and frequency (the Hertz, not related to car rental)
1/ Loudness: sound intensity, sound pressure and sound pressure level
From physics to applied acoustics in buildings. No pain, promised. Loudness is an intuitive concept: a loud noise usually has a larger pressure variation and a weak one has a smaller pressure variation. Depending on what we are looking for - the cause, the effect or the perception of noise - we use different variables and units:
- Sound intensity refers to the cause of noise (not of our concern, only of interest for acusticians). It measures energy flow at the source, so its unit is W/m2.
- Sound pressure refers to the effect of noise as a wave impacting any given surface, that is, noise as energy being transfered through air. Not of our concern either, more for physicists. Its unit is the Pascal or N/m2 (1Pa = 1N/m2).
Sound pressure level or SPL (here comes the fun) refers to the perception of noise in humans as it can be "read" by our ears. So SPL is what matters to us, poor construction buddies. For ease of numbering SPL is measured in decibels (dB). A dB is a dimensionless unit used to express logarithmically the ratio of a value (the measured sound pressure) to a reference value (the lower threshold of hearing). Decibels are used since sound pressure level expressed in Pa would be too wide. 0 dB (the lower threshold of audition for humans) equals 0,00002 Pa; whilst 140 dB (the upper human threshold or threshold of pain) equals 200 Pa. This is a range of 140 against 10 million. But logarithms are not "natural" to understand, so some examples will be of help.
Sound intensity, sound pressure and sound pressure level are obviously related, but they measure different things and they should not be confused. The table below, taken from the very useful Sengpiel audio webpage provides some tips for getting it right, at least conceptually:

Lessons from the table above:
- A raise in sound pressure level (SPL) of 3 dB equals an increase in sound pressure (field quantity) of 1.414 times, and (everything else being equal) it comes as a result of doubling the sound intensity (the source of sound).
- A reduction in sound pressure level measured inside a room of 10 dB equals a reduction in sound pressure of 3.16 times, and it comes as a result of dividing the sound intensity (noise generated on the outside) by ten.
- A typical opaque façade (not glass) can have a sound reduction index (a reduction of SPL) of around 40 dB. This means that if the SPL measured at the street is 70 dB, inside the façade one would perceive only 30 dB. Up to here, just arithmetic.
Now, if the sound reduction index of the façade could be raised from 40 to 43 dB, the perceived noise coming from the street would equal that of reducing the source of noise by half. Even more, if the façade could be acoustically improved so that its sound reduction index raised from 40 to 50 dB (difficult but it can be done), the perceived noise coming from the street would equal that of reducing the source of noise (sound intensity) by ten: ten times less cars in the street, ten times less people celebrating the victory of their football team outside.

We got the point: sound pressure level measured in dB (sometimes indicated as dB-SPL) is critical for architectural physics - a small variation can make a lot of difference. But loudness (sound expressed as pressure variation) is not the only story. Noise - what we want to avoid inside our buildings - is the mixture of sounds of different "quality", some are bass, some are treble. Is our façade or our glass pane capable of stopping each of these "noise qualities" in the same percentage? Could an envelope act as a barrier for bass and a filter for treble? What do bass and treble have to do with noise?
2/ Frequency of sound
Sound is the quickly varying pressure wave travelling through a medium. When sound travels through air, the atmospheric pressure varies periodically (it kind of vibrates). The number of pressure variations per second is called the frequency of sound, and it is measured in Hertz (Hz) which is defined as the number of cycles per second.

The higher the frequency, the more high-pitched a sound is perceived. Sounds produced by drums have much lower frequencies than those produced by a whistle.
The unit of frequency is the Hertz (Hz). For a sound vibration to be audible to human beings the object must vibrate between 20 and 20,000 times per second. In other words the audible sound has a frequency of between 20 and 20,000 Hz.
High-pitched sounds (treble) have a frequency much greater than bass sounds. The treble frequency ranges between 2,000 and 4,000 Hz while the bass range from 125 to 250 Hz.

Below: measure of frequency (wave length). Bass sound has long waves, treble has short waves.
Bad news: frequency and loudness are interrelated in the human ear. The range of 20 Hz to 20,000 Hz is called the audible frequency range - we know this already. But the sounds we hear are a mixture of various frequencies, and we don't perceive all of them with the same clarity. Let's see what the implication of this is.
The entire audible frequency range can be divided into 8 or 24 frequency bands known as octave bands or 1/3 octave bands respectively for analysis. An octave band is the band of frequencies in which the upper limit of the band is twice the frequency of the lower limit. Any particular sound or noise can be represented as a number of 8 (or 24) sound pressure levels in the frequency bands, as illustrated by the diagram below.

The response of the human ear to sound is dependent on the frequency of the sound. The human ear has its peak response around 2,500 to 3,000 Hz and has a relatively low response at low frequencies. Hence, the single sound pressure level obtained by simply adding the contribution from all 1/3 octave bands together will not correlate well with the non-linear frequency response of the human ear.
This has led to the concept of weighting scales.

In the "A-weighting" scale, the sound pressure levels for the lower frequency bands and high frequency bands are reduced by certain amounts before they are being combined together to give one single sound pressure level value. This value is designated as dB(A). The dB(A) is often used as it reflects more accurately the frequency response of the human ear.
Other, less used weighting scales, are dB(B) and dB(C). The decibel C filter is practically linear over several octaves and is suitable for subjective measurements at very high sound pressure levels. The decibel B filter is between C and A.

That was enough for theory. Let us now see how all this affects the performance of glass as a real acoustic barrier.
The four hand-sketched graphs shown here below are all taken from the first edition of a great book called "Detailing for acoustics", written by Peter Lord and Duncan Templeton. There are three editions by now and I highly recommend buying one if you are an architect interested in acoustic issues applied to buildings.
3/ Glass thickness effect
The sound attenuation of any material depends on its mass, stiffness and damping characteristics. With a single glass pane the only effective way to increase its performance is to increase the thickness, because stiffness and damping cannot be changed. The sound transmission loss for a single glass pane, measured over a range of frequencies, varies depending on glass thickness.
Thicker glass tends to provide greater sound reduction even though it may actually transmit more sound at specific frequencies. Every glass pane thickness has a weak frequency value; that is, a frequency for which that glass is less 'noise absorbent' than for the others. That value is known as critical frequency. See the graphic below:

A 4 mm-thick glass is rather transparent (poor attenuation measured in dB) for high frequencies at the range of 3500 Hz; 6 mm-thick glass is poor for frequencies around 2000 Hz; and 10 mm-thick glass performs bad at 1300 Hz. The higher the mass the less of a problem critical frequency appears to be: 25 mm-thick glass has no weak point as it can be noted from the graph above.
An insulating glass unit built with two panes of the same thickness experiences the issue of critical frequency: it is said that the two panes vibrate (resonate) together at that frequency, thus reducing the glass overall acoustic performance.
For this reason we recommend using different thickness in a double glass unit. A 6-12-4 mm glass will absorb more sound at high frequencies of 2000 Hz (claxon noise) than a 6-12-6 mm glass, in spite of having less mass. On the other hand, at lower frequencies between 125 and 250 Hz (traffic noise) this is not the case: a 6-12-6 mm glass reduces sound more effectively than a 6-12-4 mm glass. At low frequencies sound attenuation is directly proportional to mass.
4/ Laminated vs. monolithic glass
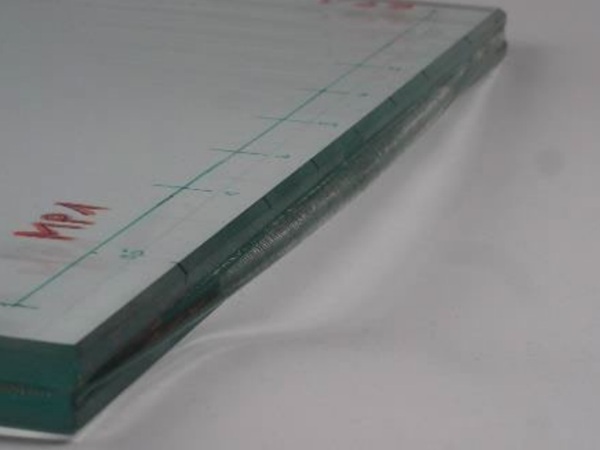
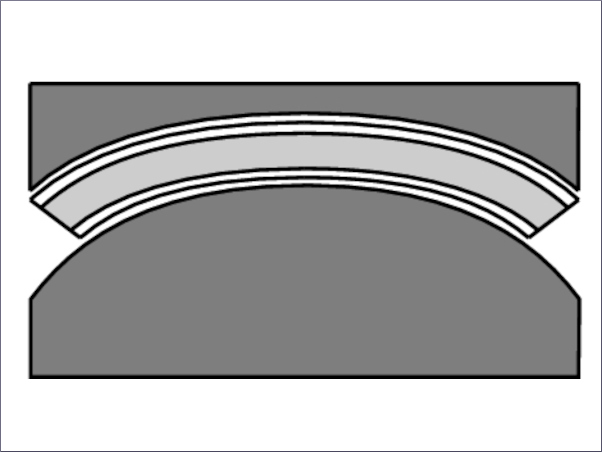
A laminated glass will attenuate sound transmission more than a monolithic glass of the same mass. See the graph below:

A laminated glass of 2+2 mm reduces sound at high frequencies considerably more than a monolithic glass 4 mm-thick (that's 8 to 10 dB of additional attenuation). Why? because the critical frequency effect disappears due to the sound damping provided by polyvinyl butyral (the soft interlayer used to permanently bond the glass panes together dissipates energy by vibration). The same applies to the 3+3 mm laminated against the monolithic 6 mm. In contrast, at low frequencies (traffic noise) the effect of butyral is less pronounced, although it is still positive (about 2 dB increase).
5/ Air cavity effect
Surprise: a standard double glazed unit does not reduce sound transmission much more than a monolithic glass. What matters is the thickness of the air space between glass panes, but only for really wide cavities.

The acoustic attenuation of a 6-12-6 mm glass is generally superior to that of a monolithic 6mm-thick glass, but only by 2 or 3 dB, and still there may be low frequency bands where the DGU performs worse. Of course if we compare a 6 mm-monolithic with a double glazed 12-6-10 mm, the sound reduction is much better at the double glazed unit.
What really matters is the width of the air space, not the small one found at double glazing but the one of a double skin. The ideal cavity width to boost sound attenuation is 200 mm. For widths less than (or greater than) 200 mm the effect is less noticeable (although a wide air space will always perform better than a narrow one). A double glazing with 10 mm air space performs almost like a 20 mm airspace.
6/ Combined air cavity & glass thickness effect
The conclusion comes in the last graph: a combination of large thickness, different one between the two panes and wide air space distance (even better if we use laminated glass) provides the maximum noise attenuation. We can reach up to 45dB.

To achieve this with a conventional double glazing width (about 28-35mm only) we have to employ an acoustic interlayer or a sort of resin between two panes in a laminated glass combined within a DGU. These acoustic interlayers or resins dissipate sound waves much more than two or three PVB interlayers as in a typical laminated glass. Some brands of enhanced acoustical laminated products are:
- Pilkington Optiphon.
- Saint Gobain Stadip Silence.
- AGC Thermobel Phonibel.
- Viracon Saflex SilentGlass.
- SGG Stadip Silence effect as part of a double glazed unit. Other brands perform similarly. By the way, the scale below is not frequency but loudness (it measures dB).
What about the effect of using argon or krypton instead of air? In theory, a higher density gas in the space between panes should have a positive effect on acoustical performance. Comparison testing of standard symmetrical insulating units indicates though that common gases as argon have virtually no increased effect on sound attenuation ratings. While some improvement was noted at some frequencies, resonance effects actually became more pronounced.
7. Some useful values
Rw index: The Rw index or sound reduction index (expressed in decibels) measures, in just one number, the acoustic performance of a specific glass unit. The higher the Rw index, the better the level of acoustic insulation offered by that glass composition. The Rw index of ordinary double glazing is around 29 dB whereas a good acoustic interlayer offers an Rw index of around 50 dB.
Rw is a single figure rating for the airborne sound insulation of building elements (not just glass). It includes a weighting for the human ear and measures actual sound transmittance. Rw is measured in a laboratory, not on site (the site-measured equivalent value has the Egyptian denomination of DnT,W). The Rw value is merely an average simplifying mutual comparison of various building components. That can be confusing some times. Two glass units can have the same Rw index while one of them performs well at low frequencies and bad at high ones, and the other one performs just the opposite.
C and Ctr factors: To slightly avoid this issue two spectrum adjustment factors: C and Ctr, have been added to modulate the Rw average. For sound waves featuring high frequencies, the factor C is added to the Rw value. For lower frequencies, factor Ctr needs to be added. The acoustic behaviour of a building component is hence defined by three numbers: Rw (C, Ctr). A building component with the values Rw (C, Ctr) = 40 (-1, -4) provides an average insulation performance of 40 dB. For higher pitched sounds the sound insulation is lessened by 1 dB (39 dB) and for lower pitched sound sources it is lessened by 4 dB (36 dB).
The table below, extracted from Saint Gobain, helps showing how these three numbers apply to different laminated units with acoustic interlayers.
Sound reduction index values for several laminated glass units with acoustic interlayers. The thickness shown at the right column is the total one. 13 mm means 6 mm + 6 mm + 0.8 mm interlayer.
C takes into account medium and high frequency noise sources such as TV, music, loud conversations or aircraft noise a short distance away. Ctr takes into account medium and low frequency noise sources such as urban traffic noise or aircraft noise a long distance away.
Pink Noise: Expressed in dB(A), this is an assessment of the sound insulating properties of a building material over specified standard frequencies, which represent general activity noise when equal levels of power are applied at each frequency. So, in pink noise each octave carries an equal amount of noise power. Funnily: the name arises from the pink appearance of visible light with this power spectrum.
Ra: Ra is the abbreviation for the sound reduction index when the spectrum adaptation term C is applied to the single number weighted sound reduction index (Rw), using pink noise as a sound source.
Ra,tr: Ra,tr is the abbreviation for the sound reduction index when the spectrum adaptation term Ctr is applied to the single number weighted sound reduction index (Rw) using pink noise as a sound source.
So far so good. Acoustic performance of glass should now be less of a dark matter for us. But this is not all: remember that detailing to achieve a proper air tightness between glass and frame will always be required! Loose gaskets can severely harm the best glass selection for acoustics...

Source: Façades Confidential
Author: Ignacio Fernández Solla, Facade consultant in Arup
You can find the full article published HERE.


