Source: Glass Structures & Engineering
Authors: Roberto Zárate-Espinosa, Alejandro C. Ramírez-Reivich, Martín Ortega & Marcelo López-Parra
DOI: https://doi.org/10.1007/s40940-024-00282-z
Abstract
The current design of workspaces for companies is focused on minimalistic and modern styles prioritizing the aesthetic appearance with illuminated open spaces and the use of glass walls. If the acoustic performance is not considered, inappropriate Reverberation Times (RT) might lead to difficulties for hearing a speaker or teacher during courses and conferences, causing problems in the learning process. Additionally, there might be high sound transmission between adjacent work rooms. This paper presents the development and experimental validation of numerical models using Statistical Energy Analysis (SEA) to calculate the sound reduction index through a glass wall that separates two adjacent work rooms. These structures are dedicated to conferences and educational uses but cannot be properly used due to their high sound transmission and inappropriate reverberant time. The sound insulation prediction results are validated with experimental measurements carried out in the adjacent rooms under the standard ISO-140. Afterwards, a SEA model is used to provide some acoustic correction design guidelines for these types of constructions. To improve the acoustical performance in the rooms, the acoustic effects of different absorbent panels placed on the walls and ceiling were investigated, choosing a suitable material that complies with the recommended ranges of RT and with less amount of absorption area. The SEA model is then used to understand the effects of openings size between the panels that make up the glass wall on the sound insulation capacity between rooms. Finally, a SEA model is reformulated to quantify the effect of the application of double walls for sound insulation between rooms, which implies the increase of weighted sound reduction index in 9 dB with respect to measured data.
1 Introduction
The vibro-acoustic performance is one of the key factors to be considered for the design and construction of buildings, considering the indoor and outdoor environment.
For buildings constructed around an urban acoustic environment (Brown et al. 2011), it becomes crucial to have good noise protection on outdoor building components because occupants are exposed to noise sources such as traffic noise and leisure noise. On the other hand, using indoor building components with a high sound insulation prevents the transmission of home appliances, electronic tools and voices coming from contiguous rooms. Sound insulation provides acoustic comfort and privacy to the occupants.
Acoustic comfort, quality of life and the health benefits (exposure to a constantly noisy environment can cause cardiovascular disease, effects on sleep, hearing impairment, among others (Basner et al. 2014; Hurtley 2009; Brown 2015)) are of prime importance. Noise control must therefore be prioritized in houses and buildings. International health organizations as (World Health Organization et al. 2011), have published recommendations for protecting human health from exposure to a noisy environment (World Health Organization et al. 2011; Berglund et al. 1999). In addition, the requirements for noise protection and the standards for minimum sound insulation level in building elements have been increased by the government organizations in different countries, becoming stricter over time. As an example, the European Union (EU) introduced noise classification schemes and acoustic specifications in the building regulations (Rasmussen and Machimbarrena 2014). However, each country of the EU has its sound insulation requirements.
In France (Code de la construction et de l’habitation 2018; Alonso et al. 2020), new buildings airborne sound insulation of constructive elements (walls and floors) should not be less than 53 dB and the impact sound should not be higher than 58 dB. For the existing buildings, acoustic requirements are established according to the zone. In other countries like the United States, there are building codes (International Code Council Series 2018), but the acoustic regulations are only focused on new buildings according to their current standards (Alonso et al. 2020), where airborne sound insulation should not be less than 45 dB and the impact sound should not be higher than 65 dB under the standard ASTM E492-09. The acoustic requirements of EU regulations and standards published by other countries have been investigated and compared. The authors have also revised recommendations for old buildings and their compliance with the values required according to the regulatory standard (Alonso et al. 2020).
Several researchers have performed studies to determine which are the building elements that have the best noise abatement for a good indoor sound insulation, achieving a good urban acoustic environment through a series of design strategies from building envelope elements, such as facades, roofs, balconies, windows, etc. (Yang and Jeon 2020; Kim and Kim 2007; Cheng et al. 2000; Li et al. 2003)
However, the acoustical comfort not only depends on the sound insulation of the building elements, different acoustic conditions (ambient noise, reverberation time, speech intelligibility, auralization and background sound levels.) involved in auditory perception should be considered. To improve sound perception within rooms, several recommendations have been studied in buildings such as residential buildings (Torresin et al. 2019, 2020), houses (Hoshi et al. 2021; Pan et al. 2023), eating establishments (cCakır and İlal 2021), museums (Orhan and Yilmazer 2021), airports (Li and Zhao 2023) and offices (Jo et al. 2022).
Other studies have focused on the influence and perception of the reverberation time inside of different types of structures, mainly buildings employed for verbal communication and educational uses, for example, conference rooms, auditoriums, and classrooms (Escobar and Morillas 2015). Inadequate reverberation reduces the intelligibility of the spoken word, causing problems in the learning process that involves the communication between the teacher and students and produces higher background noise levels (Lewinski 2015; Kob et al. 2008), affecting teacher’s voice and student’s concentration resulting in an inappropriate understanding of the content of their classes (Kob et al. 2008; Hagen et al. 2002). The reverberation time measurement can be done using standard methods described in ISO-354 (ISO 2003) and ISO-3382 (ISO 2008).
These methods have been used for the characterization of reverberation time in a school classroom (Russo and Ruggiero 2019), in the frequency range of 100 to 8000 Hz, initially obtaining values of reverberation time in the range between 2.48 to 1.37 s. Since the optimal value recommended for these structures is 0.8 s in a frequency range of 500 to 1000 Hz, sound absorbing material was added on some walls of the room, decreasing the reverberation time from 1.48 to 0.54 s from 100 to 8000 Hz and complying with the optimal time of 0.73 to 0.76 from 500 to 1000 Hz. Several authors establish their recommendations of the reverberation time based on the volume of the room (Escobar and Morillas 2015; Hodgson 2004). In Sato and Bradley (2008), also reporting the reverberation time (0.41 s), but integrating teacher voice levels (60.4 dB A) and noise levels (49.1 dB A) to carry out a detailed analysis and suggest improvements for room acoustics design. Similar studies have been carried out in classrooms of schools with different levels of study, establishing a limit for the acceptable values of the noise levels, reverberation time, and intelligibility conditions to achieve suitable acoustics in educational buildings (Escobar and Morillas 2015; Ricciardi and Buratti 2018; Zannin and Zwirtes 2009; John et al. 2016; Topak and Yılmazer 2022).
The acoustic conditions described above not only help to maintain an optimal acoustic environment inside the building, but they also favor a pleasant hearing sensation, efficient verbal communication, and good acoustic insulation.
1.1 Overview of modeling and design of buildings
The airborne sound insulation is a design parameter to evaluate the acoustic performance afforded by a building element, which can be computed from experimental and modeling techniques. For example, the standards ISO-140 (ISO 1998) and ISO-18233 (ISO 2006), used to measure and quantify the transmission of sound through the element is expressed in terms of the Sound Reduction Index (SRI). There are full reports of measurement studies in plasterboard walls, single panels, windows, among others (Fausti et al. 1999; Stani et al. 2005; Mansilla et al. 2017; Buratti et al. 2013; Zannin and Ferreira 2007). Another focus of studies has been the sound insulation provided by a wide variety of materials used in building construction (Keränen et al. 2019), generating useful information for the selection of materials. Other current standards have been proposed for the prediction of the acoustic performance in buildings. One of these is EN-12354 standard (EN 2000), which allows a quick iteration with the main design parameters such as dimensions and material properties, providing reliable estimates of the sound transmission over a broad frequency range, and with a low computational time. However, this standard presents some restrictions and error margins in the prediction of the airborne sound transmission between adjacent rooms, as described in Galbrun (2008).
Many numerical and empirical models have also been developed to predict the sound transmission through structural elements. A review of the different approaches to predict the sound transmission loss of buildings can be found in Santoni et al. (2020), Santoni et al. (2019) and Zarastvand et al. (2022), highlighting advantages and drawbacks of different types of approaches, based on analytical and semi-analytical solutions, wave-propagation, and numerical methods. A case study that is worth mentioning, Zarastvand et al. (2022) is the modeling of the acoustic response in low frequency ranges for multilayer panels, using hybrid approaches that have been developed combing finite element method (FEM) or wave-based approaches with a transfer matrix method model.
Including numerical techniques like FEM and boundary element method (BEM) in hybrid approaches, help in increasing simulation accuracy and help in solving many problems in low frequency ranges, where structural elements are generally characterized by a low modal density (Santoni et al. 2019). Some applications of these numerical techniques have been carried out modeling the sound transmission through double walls (Díaz-Cereceda et al. 2012), presenting the finite layer method as a discretization technique, which combines a FEM discretization in the direction perpendicular to the wall with trigonometric functions in the two in-plane directions, obtaining a good performance when compared with experimental values in a frequency range from 63 to 3150 Hz. Models have also been developed to investigate the acoustic response and sound transmission through single structural panels (Yang et al. 2017, 2021; Errico et al. 2019) and multilayer structures (Atalla 2014). Among these applications (Maluski and Gibbs 2000), the sound transmission between adjacent rooms has been modeled at low frequencies using FEM, confirming that the sound-pressure level difference is lower in similar rather than in different room configurations. The FEM has also been utilized to predict the vibration transmission across junctions formed from heavyweight walls and floors, the junctions considered were L, T, X and H-shaped junctions (Hopkins et al. 2016; Poblet-Puig and Guigou-Carter 2017). In another work (Yoo and Jeon 2014), the effects of resilient isolators and viscoelastic damping materials on reducing the impact sound across a floating floor is studied using FEM simulation and in situ measurements. The results indicated that the impact vibration acceleration level and floor impact sounds at low frequencies were significantly decreased due to the installation of damping materials.
Hybrid approaches present complications in simulations for high frequencies, leading to errors in the calculations of sound transmission, using a high computational time and expensive computing equipment, while the Statistical Energy Analysis (SEA) can be applied to medium and high frequencies without major difficulties.
The SEA is one of the most used techniques to predict the sound transmission in buildings due to the simplicity of modeling, achieving reliable estimates in medium and high frequency ranges with low computational cost. EN-12354 standard (EN 2000) is based on the first-order SEA model (Galbrun 2008). It is a technique described by Lyon as in Lyon and DeJong (1995), it consists in subdividing a vibro-acoustic system into subsystems to perform power balances so that the average energy in each subsystem can easily be determined. It can also include experimental information from the laboratory such as modal density, loss factor and coupling loss factor, which can be obtained using different type of tests as Carfagni and Pierini (1999); De Langhe and Sas (1996). SEA has also been applied in aerospace (Petrone et al. 2019), railway (Forssén et al. 2012), household appliances (Zárate et al. 2020) and automotive industry (Musser et al. 2012; Lee et al. 2019), to predict airborne and structure borne sound, obtaining a good prediction in medium and high frequencies, also detecting the main transmission paths of noise and vibration.
A typical application of SEA in building elements, reported in Decraene et al. (2018), is the modeling of the level of sound attenuation that is isolated by walls and floors when sound waves pass through them, referred to as sound transmission loss (STL). To calculate the STL of a thin steel plate, a polymethyl, methacrylate panel, a thick brick wall and a sandwich panel, use the hybrid modal transfer matrix-statistical energy analysis method. The authors compare their results with other reliable methods, achieving an overall good agreement with the experimental data for each case of study. In other work, a STL study is carried out on single and double walled plates with absorbing material by means of a SEA model (Oliazadeh et al. 2019), the SEA results were validated and compared with experimental data evaluated from three different experimental methods. The investigation carried out shows that the sound intensity method with a direct approach is more accurate than the other experimental methods. The paper also researches the effects of using different absorbing materials.
On early design stages, SEA is used for acoustic analysis of sound transmission in facilities that have been designed for many different uses (Rioperez Rodriguez et al. 2019), calculating the sound transmission between adjacent and non-adjacent spaces. The models are validated with experimental data from a series of airborne sound insulation measurements, obtaining a difference with respect to experimental data of 10 dB for adjacent spaces and 12 dB for non-adjacent spaces, on frequency range from 100 to 3150 Hz. This model was very useful in early stages of acoustic design process.
Several SEA models are focused on predicting acoustic specifications in building regulations such as the airborne sound insulation and sound impact. To calculate the airborne sound insulation of a timber-concrete composite floor (Churchill and Hopkins 2016), two SEA models are developed, which include experimental data of the subsystems and the bending stiffnesses of orthotropic plate is predicted using different theories. The prediction presents a difference with respect to experimental data in the SRI of 2 dB. To reduce the impact noise transmission across floating floors in residential buildings (Huang et al. 2021), a SEA model is used to predict impact sound pressure level in the receiving room beneath a floating floor, obtaining good agreement with the experimental data on a range from 100 to 3150 Hz. This shows that the SEA is an appropriate approach to predict the impact sound insulation. The influence of the factors to achieve the optimized structure is also investigated by the authors.
In exploring the potential of the SEA technique, several vibro-acoustic problems have been solved. One of these is the computing of SRI between two rooms separated by a double wall (Díaz-Cereceda et al. 2013), where different ways of isolating the coupling loss factor (CLF) were studied. The objective was to simplify the models and perform a study of the acoustic effect of steel studs located between two leaves of the double wall, on a range from 250 to 3150 Hz. The noise reduction (NR) of conical (Gupta and Parey 2023), cylindrical (Gupta and Parey 2022a), hemispherical (Gupta and Parey 2022b) and cuboid acoustic enclosures (Lei et al. 2012) has been explored, developing a SEA model to predict STL for each acoustic enclosures listed, including the resonant and non-resonant transmission. The models were validated with an experimental sound intensity technique; good agreement was observed by the authors.
1.2 Scope of this work
The objective of this research is to develop and validate different SEA models to predict sound insulation through a glass wall that separates two adjacent work rooms. This structure is dedicated to conferences and educational uses, but these cannot be properly used due to its high sound transmission and inappropriate reverberant time. The experimental and theoretical methods to obtain the SEA properties and parameters as input to different SEA models are described. The predictions are performed in the frequency range between 125 and 3150 Hz using diffuse acoustic field excitation. The SRI prediction results are validated with experimental measures carried out in the adjacent rooms under the standard ISO-140. Afterwards, a SEA model is used to provide some acoustic correction design for this type of construction. To improve the acoustical performance in the rooms, the acoustic effects of different absorbent panels, the size of openings in the glass wall and the application of double wall between rooms were investigated.
The authors estimate that the present research work contributes to the following:
- Development of the SEA model. In addition to the SRI predictions through a glass wall, the model should be able to provide information on the energy distribution and sound transmission path.
- Experimental characterization of reverberant time of each work room and sound insulation through a glass wall that separates the work rooms.
- Provides outputs that can be useful not only to characterize the acoustic field of rooms but also to feed simulation models.
- Validation of the SEA model with experimental data.
- Determination of the dominant flanking paths from the source room to the receiver room using the SEA model validated.
- Determination of the influence and effects of different absorbent panels, the size of openings in the glass wall and the application of double wall between rooms on sound insulation capacity and reverberant time of the rooms. The proposed methodology and results reported herein can be used as pre-designed information for other type of workrooms found in industries.
The SEA models and methods considered to simulate the sound insulation through the glass wall that separates two work rooms are described in Sect. 3. In Sect. 2 the experimental measurements to characterize the reverberant time of each work room and sound insulation between rooms (the RT measured are used as input data for SEA model) is detailed. The results of Sect. 4 include the validation of a model prediction. To improve the acoustic performance of work rooms, a SEA model is used to provide some acoustic correction design for this type of construction (Sect. 5).
1.3 General details of construction
The two adjacent work rooms that were investigated in this study are normally found in industrial companies and are dedicated to conferences and educational uses. Nowadays, this type of structures are built with modern and minimalist designs prioritizing aesthetics and architectural expressiveness, where illuminated open spaces and glass walls and façades are mainly considered. However, some designs use wall materials with a low sound absorption, which can generate a high sound reflection in the rooms. In addition, if there is an inadequate assembly of the panels that make up the rooms, a high transmission of sound can be generated the adjacent room. It is common to find out that both, room functionality and sound quality are not considered in the design.
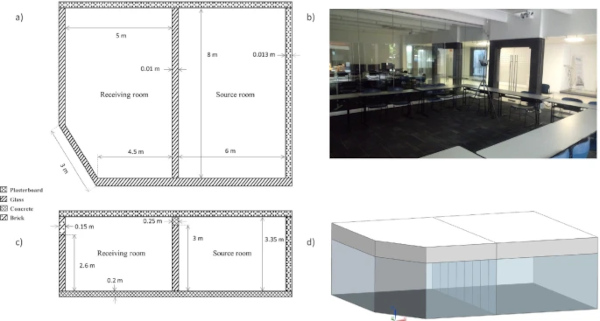
Table 1 Mechanical properties of each structural component of the rooms - Full size table
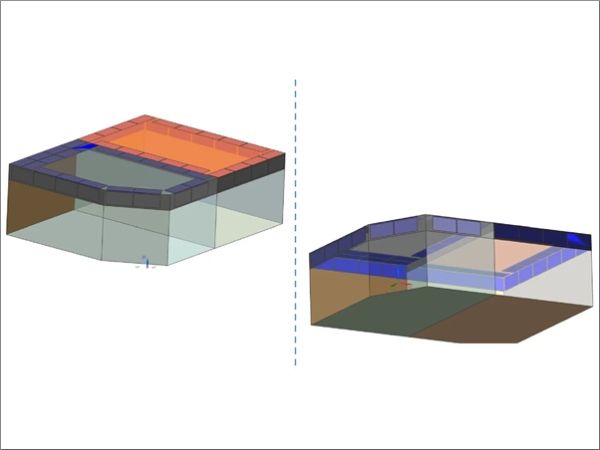
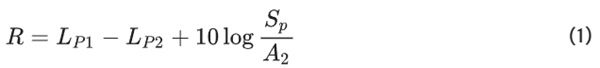
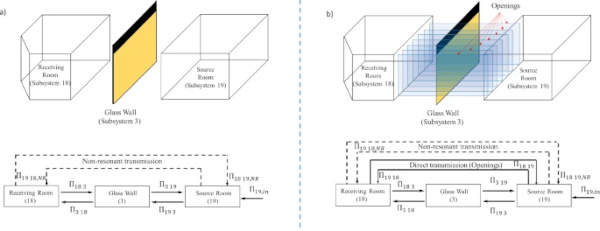
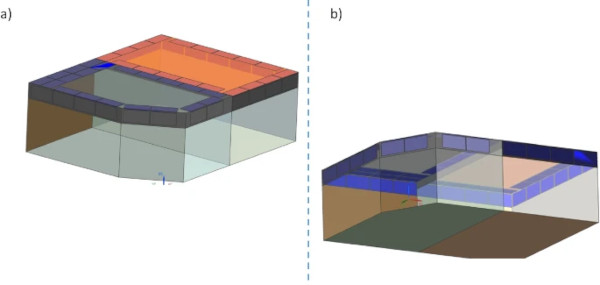
The construction studied in this work is shown in Fig. 1. Due to its design and construction, it presents two acoustic problems. First, a high sound transmission between both rooms is present, causing that both rooms cannot be used at the same time; the sound generated by an event held in one of the rooms is clearly heard in the other room, providing a poor transmission of information, confusion, and acoustic discomfort to attendees. Secondly, there exists an inadequate reverberation time which is linked to the material and the dimensions used in the construction of each room, generating a problem of communication for the speaker. For this analysis, two rooms are considered, one of the work rooms was used as the source room and the adjacent multipurpose room was used as the receiving room. The main dimensions and materials of walls, floors and ceiling are given in the Fig. 1a and c, whilst mechanical properties are summarized in Table 1.
Floors and ceilings of the rooms are made from concrete and plasterboard, respectively. The wall of the right and back side of the source room, and wall of back side of receiving room are built of plasterboard with a thickness of 0.013 m. The front wall of the rooms and the wall of left side of the receiving room are made with two materials, the upper part of the wall is built of brick considered a thickness of 0.15 m and lower part of the wall is built of glass panels with thickness of 0.01 m, both sides are connected by U-shaped channel profiles, which are screwed to part of the brick wall and join the glass wall part with connectors (this description does not take into account the doors), as shown in Fig. 1d. The source room is separated from the receiving room by a wall built of glass, which is placed in the same way as those described above (with the glass wall and bricks), but this was connected to a concrete beam. The full wall glass is formed by 8 panels with height of 3 m, width of 1 m and a thickness of 0.01 m, the panels are joined and sealed with silicon.
The source and receiving room have a volume of approximately of 134 m³ and 127.47 m³, respectively. This information defines the structure to be considered for the SEA models.
2 Experimental studies
For the acoustic characterization of the sound transmitted between the rooms and the reverberation time of each room, a sound insulation measurement was carried out. The experimental data obtained was used to validate the SEA model. The sound insulation measures are done according to the ISO-140-4 (ISO 1998), standard field measurements of airborne sound insulation between rooms. The goal is the measurement of the Sound Reduction Index between two rooms separated by a glass wall.
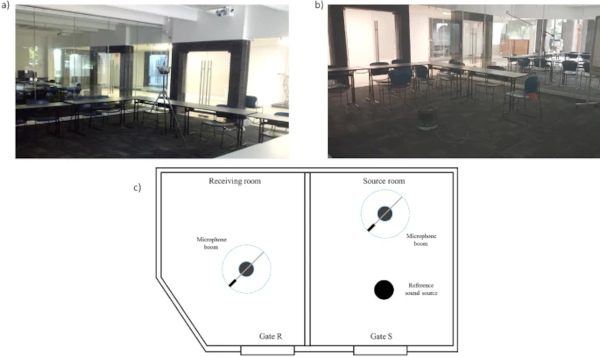
The Sound Reduction Index R is determined by following measurement formula (ISO 1998):
where LP1 and LP2 are the average sound pressure levels in the source room and receiving room, respectively ( D=LP1−LP2 is level difference), Sp area of the glass wall, A₂ equivalent absorption area in the receiving room and can be evaluated from:
where V₂ is the volume and T₂ reverberation time of the receiving room. Combining Eq. (1) and Eq. (2), the Sound Reduction index equation is determined, as
Determination of SRI is according to the standardized method reported in ISO (2021), it is assumed that a sound field in the source and receiver rooms are diffused. However, in practical measurements the ideal condition of a perfect diffuse field is not met (Lietzén et al. 2024). When the sound reduction indices of a wall or floor are obtained experimentally by means of the assessment methods they inherently introduce uncertainty to the measurement results (Reynders 2019; Reynders and Hoorickx 2023). This uncertainty can be large, especially at low frequencies, where the modal density of the receiving room is low. This principle is generally used for laboratory measurements, but if some considerations such as the reverberation time of the rooms, the volume of the rooms and safety factor are taken into account in the measurements it can also be applied in field measurements (in site), as described in ISO (1998). EN-12354 standard (EN 2000) which is widely used for the characterization of airborne sound insulation between rooms by means of field measurements.
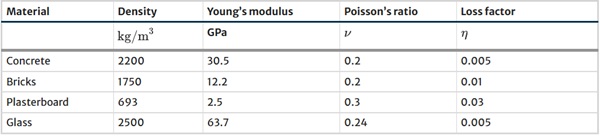
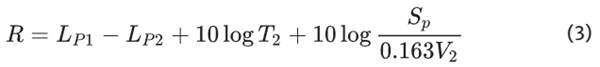
The tests were carried out with all the furniture normally used for courses and conferences such as tables and chairs. The sound pressure levels measurements are performed in the two adjacent work rooms construction described in Sect. 1.3. The Fig. 2 shows the experimental set-up to measure the sound pressure level (SPL) in both rooms.
The sound source (B&K Type 4204) is placed in the source room, located at a distance higher than 0.5 m from the walls, as shown in Fig. 2b, which is used to emit a constant noise signal. The SPL in both rooms was measured simultaneously using two booms with an arm of 2 m in length with microphone (B&K Type 4942-L) and processed with a data acquisition system (B&K Type 3160-A-022), as shown in Fig. 2a. It is also verified that the SPL transmitted to the receiving room is 10 dB higher than background noise level in each frequency band. The measurements were collected on a range from 100 to 3150 Hz and processed into one third-octave frequency bands with a period of time averaging 64 s.
Figure 3 shows experimental set-up to measure the reverberation time in the receiving room, where the sound source is located at a distance higher than 0.5 m from the walls. The boom with microphone is placed at a distance higher than 1 m from the walls and a height of 1.5 m from the floor. The measurements were performed using the interrupted noise method according to ISO-3382 (ISO 2008) standard, and the sound power generated by the source to excite the room. The measurements were collected on a range from 100 to 3150 Hz into one third-octave frequency bands as the mean of four repetitions. The reverberation time of the source room is measured using the same experimental set-up.
3 Method: description of SEA models
To develop a SEA model, the structure to be studied is divided into subsystems, then each one of the defined subsystems is characterized with its SEA parameters to calculate the coupling loss factor. To achieve the above, energy flow relations between subsystems are defined and studied. Finally, a SEA formulation of the study case is obtained. To solve a comprehensive SEA system, an input power is associated to the subsystems and power balances between the different subsystems are performed.
For a full explanation of the SEA theory (hypotheses, steps of the process, equations) the authors refer to some books in the literature (Lyon and DeJong 1995; Le Bot 2015). All parts of the work rooms are modeled as idealized elements (i.e. rectangular plates or cubic-shaped acoustic cavities), standard state-of-the-art SEA formulas are considered and the description is carried out just by providing basic references. However, for some other complex parts, that are particular to this case study the detailed formulation is provided. The loss factors of cavities are obtained from experimental measurements of the reverberant time carried out in Sect. 2 and are included in the SEA model.
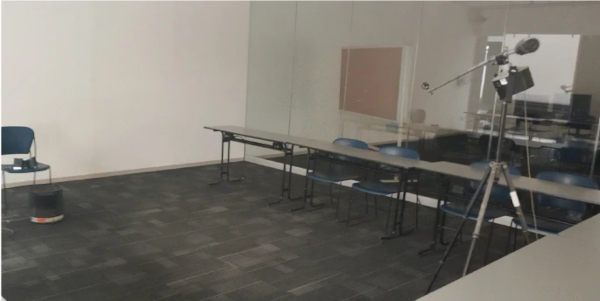
The SEA model is formed by considering the two rooms (with a reverberant field) with their walls, ceilings, floors, one common wall that separates the rooms and is excited by a sound source placed in the source room. The room where the sound is transmitted to is called the receiving room. The subsystems definition considered in these analyzes is shown in Fig. 4. The SEA model has a total of 19 subsystems. It is based on SEA subsystems of two different types: plates and acoustic cavities.
Based on the sound transmission modeling process, presented in Zárate et al. (2020), only the bending behavior of the plate type subsystems is considered here. The results will corroborate that this is a correct modeling decision because the structural path is not the most critical one. The SEA parameters required for the model computation are
![]()
the bending stiffness,
![]()
the bending wave speed, the critical frequency and the modal density defined below in Eq. (4) and Eq. (5)
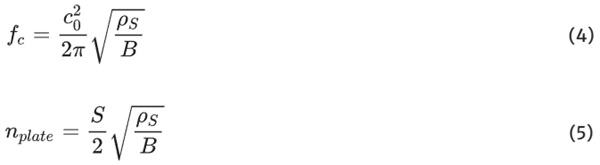
where ρₛ is the surface density, c₀ is the speed of sound, S is the plate surface and ω=2πf is the angular frequency. For the acoustic cavities the parameter is the modal density as
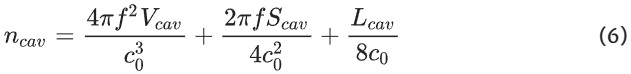
where Vcav is the cavity volume, Scav is the total surface of the cavity and Lcav is the total lengths of all edges. The properties of the materials and geometric of subsystems are given in Table 1 and Table 2.
Table 2 Geometric properties of subsystems used in the SEA model: At the top for the plate subsystems type; at bottom for the cavity subsystems type - Full size table
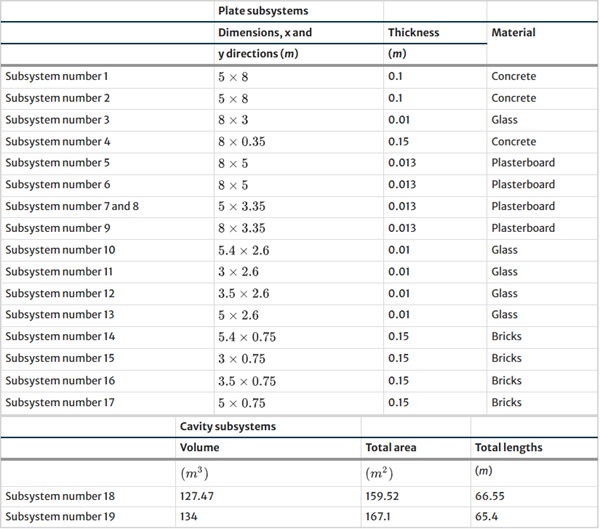
The structure of the work rooms is divided into 17 coupled structural subsystems. The rectangular plates of the receiving room are labelled with the numbers 1, 3, 4, 6, 7, 10, 11, 12, 14, 15 and 16. For the source room the subsystems 2, 3, 4, 5, 8, 9, 13 and 17 are indicated in the Fig. 4b. The multipurpose rooms have two interior cavities: receiving cavity indicated with subsystem number 18; source cavity indicated with subsystem number 19 that contains the sound source as shown schematically in Fig. 4c. The plates indicated with subsystem number 3 and 4 are the elements that separate the source cavity from receiving cavity. A fundamental part of model is that it is considered a non-resonant transmission mechanism between the source room and the receiving room in glass wall (subsystem 3).
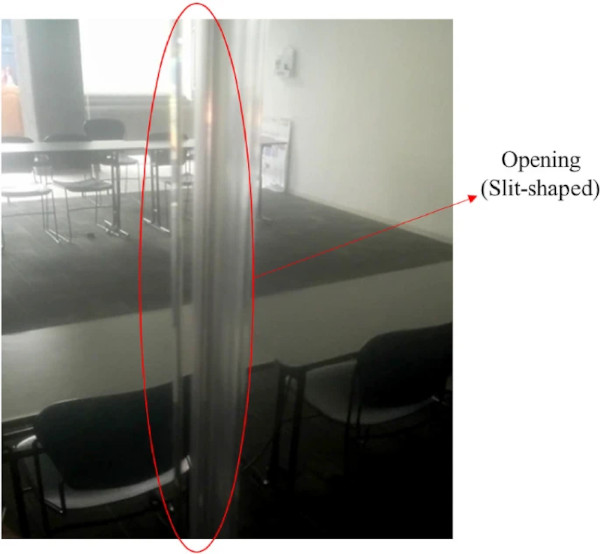
Due to the openings identified in some joints between the panels that make up the wall that separates the two rooms (as shown in the Fig. 5), two SEA models are developed with the same number of subsystems. The difference between the models is that for model 1 only a non-resonant transmission between the rooms is considered, while for model 2 a non-resonant transmission and a direct transmission through the openings are considered. The results obtained with both models will be compared with experimental data.
It is verified that all the parameters required for the SEA models are correctly determined and input power (Πin,₁₉=1Watt) is associated to subsystem 19 (source cavity). The SEA models formed by 19 subsystems are solved and the energy of every subsystem is obtained. The energies obtained with both solutions are used to calculate the Sound Pressure Level (SPL) in the receiving room (subsystem 18) and in the source room (subsystem 19), which are employed to estimate the sound reduction index through the glass wall (subsystem 3) with Eq. (3).
3.1 Connections and loss factors of subsystems
For the vibration transmission through the structural junctions in both models, the formulas for τB,ij bending wave transmission through L, T and X junctions provided in Hopkins et al. (2016); Poblet-Puig and Guigou-Carter (2017) are considered. The coupling loss factor for two plates is computed as
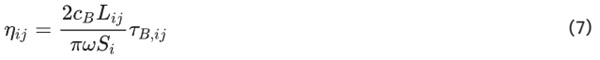
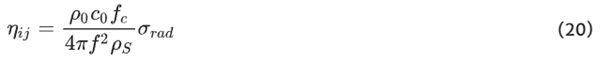
where Si is the surface of the plate of the subsystem i and Lij is the length of the junction between subsystems i and j. To consider the sound power radiated by the plates to the cavities in the SEA models, it is also required to obtain a coupling between both subsystems (for example subsystems 18, 3 and 19). The coupling from a room i to plate j is obtained as Craik (1996)
where ρ₀ is the density of air and σrad the radiation efficiencies. The radiation efficiencies of the plates are computed as Craik (1996); Hopkins (2012)
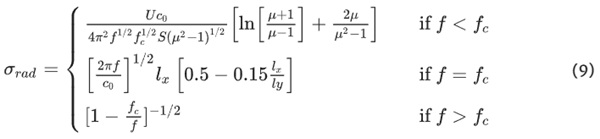
where U is the perimeter of the radiating area, lx and ly are the plate dimensions and μ=(fc/f)¹ᐟ². A very important transmission path in the models is the non-resonant transmission and direct sound transmission from the source room to the receiving room. It is done through several mechanisms illustrated in Fig. 6.
The coupling loss factor for the power transmitted between source and receiving rooms is given by Craik (1996)

where Sc is the area of the linking surface between cavities, Vi is the volume of the room called i and τij is the sound transmission coefficient. For the model 1, the CLF between rooms is computed by considering the sound transmission coefficient due to non-resonant transmission for glass wall according to the mass law (Craik 1996).
Finally, for direct transmission mechanism in model 2 due to the openings array illustrated in Fig. 6b, the CLF is computed by considering the transmission loss provided by the Gomperts’ model of slit-shaped apertures, given by Gomperts and Kihlman (1967)
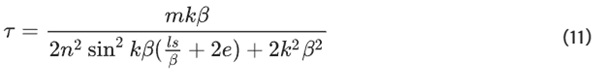
where m is dependent in the nature of the incident sound field and n on the position of the aperture, k is the wave number, β is the width of the slit, ls is the depth of aperture and e is the end correction factor for the slit-shaped aperture. The formulation for a single opening is extended to the modelling of openings arrays, by assuming that the contribution of each aperture is independent of the others (they behave as if they were alone). The total sound transmission is computed as the combination of 7 rectangular openings which are 2 mm in width and 10 mm thick. This hypothesis is sustained in the results presented in Cordioli et al. (2009), Phong and Papamoschou (2013) and Zárate et al. (2020).
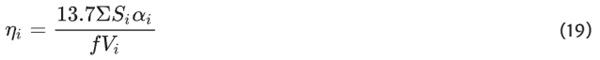
To develop the SEA models, the internal loss factor for each subsystem is needed. For each structural subsystems the loss factors are given in the Table 1. On the other hand, the internal loss factor of the acoustic subsystems is obtained using the reverberation time results shown in Fig. 7. The loss factor of the acoustic rooms is calculated as Craik (1996)
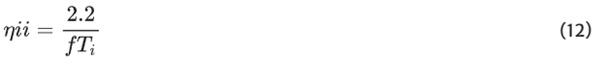
where Ti is the reverberation time of subsystem i.
4 Results
4.1 Reverberation time
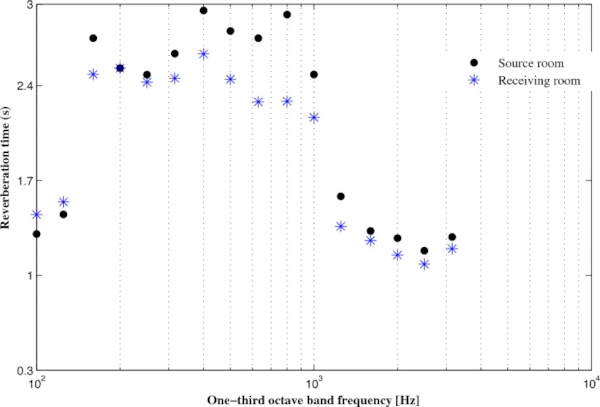
As mentioned above, the reverberation time together with sound insulation should be key factors in the design of rooms for educational uses. Several acoustical standards from different countries provide reference values for reverberation time. For example, French regulations, which are one of the most widely used (World Health Organization - WHO 2001), they recommend that the reverberation time for classrooms with a volume of less than 250 m³ should be between 0.4 and 0.8 s. The reverberant time being the arithmetic mean of the measurement in the frequencies of 500, 1000, and 2000 Hz. These recommendations are appropriate for this case study. Some other recommendations for reverberation times are reviewed in Zannin and Zwirtes (2009). Figure 7 shows the measured average reverberation times for each room, respectively, at the octave band frequencies.
The source room has an average reverberation time between 2.9 to 1.1 s in the frequency range from 100 to 3150 Hz, with an RT of 2.8, 2.4 and 1.2 s at frequencies 500, 1000 and 2000 Hz, respectively. The receiving room shows a RT between 2.6 to 1 s in the frequency range from 100 to 3150 Hz, with a reverberation time of 2.2, 2.1 and 1.1 s at frequencies 500, 1000 and 2000 Hz, respectively.
When comparing the experimental values obtained with those recommended at the frequencies of interest, it is possible to conclude that the acoustic quality of the room is inadequate for educational uses. Therefore, it is necessary to carry out acoustic corrections in the room by adding sound absorbing material on some walls or the ceiling of the rooms, so as to decrease the reverberation time of each room.
4.2 Sound insulation
Another acoustic quality factor investigated was sound insulation between rooms. This parameter can be characterized into a single-number called weighted sound reduction index (RW), it is determined by comparison between the values one-third octave frequency band (obtained from measurement) and reference curve (constructed according to the properties of the human ear) in frequency range from 100 to 3150 Hz, according to standard ISO 717-1 (ISO 2013). This simplifies and specifies the acoustic requirements in buildings to a single number (based on results of measures in one third bands), several researchers and standards base their recommendations terms of the Rw. As ANSI S12.60 standard (American National Standard Institute 2010), which recommend that the sound insulation between classrooms and corridors should be 45 dB.
The SRI experimental was estimated by the Eq. (3) within a frequency range from 100 to 3150 Hz in one-third octave bands, using the SPL measured in the rooms and reverberant time measured of receiving room, as described in Sect. 2. Using the experimental measurements, the weighted sound reduction index (RW) is obtained as described in ISO 717-1 regulation, the value RW is then specified at frequency band of 500 Hz of reference curve after shifting.
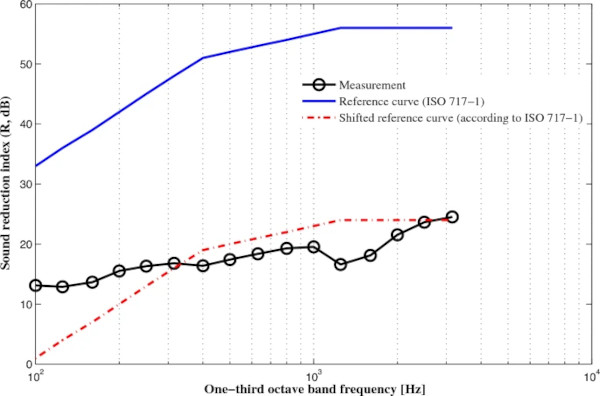
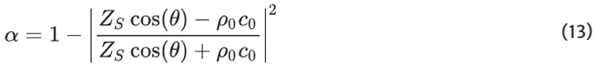
Figure 8 shows the measured frequency dependency on sound reduction index between rooms and the shifted reference curve for the determination of RW = 20 dB for the glass wall. This value of sound insulation between rooms is far below the specified by the standard, this could be attributed to the direct transmission of noise through the openings in the glass wall. Therefore, it is necessary to carry out an investigation of the sensitivity and effect of the openings on the sound insulation capacity between the rooms.
4.3 Comparison of the SEA models and experimental results
In order to predict the SRI with the Eq. (3) and the SEA model, the assumption of diffuse fields in the rooms must be ensured. To guarantee fulfillment of the diffuse field assumption in the SEA model is verified the normalized attenuation factor (m¯<1, attenuation factor of wave per length times the mean free path) as defined in Le Bot and Cotoni (2010), it is satisfied for all the subsystems in the frequency range of interest. Furthermore, it was ensured that the SEA model satisfies the rest of the SEA hypotheses.
SEA simulations are compared with the experimental measurements of SRI between two rooms separated by a glass wall (subsystem 3) as described in Sect. 2. The SRI predictions were calculated using the Eq. (3). For each prediction several parameters were used: the SPL of each the room (assuming diffuse field) obtained from the energies provided by the SEA model solution, the reverberation time of the receiving room shown in Fig. 7, the area of the glass wall and the volume of the receiving room. The SRI calculations using both SEA models were obtained within a frequency range from 125 to 3150 Hz in one third-octave frequency bands, where SEA hypotheses are satisfied.
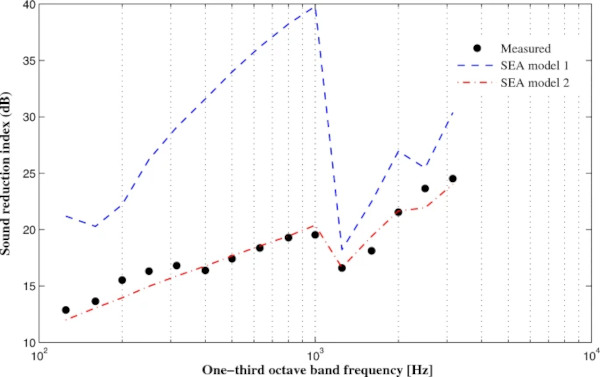
Figure 9 shows the simulation estimations and experimental measurements, where there is a good agreement between SEA model 2 and experimental data. While the SEA model 1 presents a wide variation with respect to the experimental data. As it can be observed in Fig. 9, the SEA model 1 prediction presents a large difference from 125 to 1000 Hz, but from 1250 Hz band where critical frequency of wall glass is found, the prediction shows a good trend with the measurements.
For SEA model 2, the prediction presents a maximum difference in terms of magnitudes with respect to experimental data of 1.7 dB at frequency band of 2500 Hz. Other considerable differences are found from 200 to 315 Hz. On the other hand, the prediction presents a very good agreement specifically at critical frequency of wall glass. These differences between SEA model 2 and experimental data could be caused by the size of the openings used or not considering other apertures in the model. However, they are within acceptable limits.
5 Simulating the acoustical corrections of the rooms by means of the SEA model
The comparison in Fig. 9 shows a good agreement between the results predicted by the SEA model 2 and the experimental measurements, leading to validation of numerical model and that it can be used to know the vibro-acoustic behavior of the structure, power exchanges between subsystem, visualizing information which is difficult to measure in the experiments and making modifications in the model to find the appropriate acoustic performance for the final use of the building.
In this section, several acoustic corrections to concurrent design of the work rooms are proposed. To improve the acoustical performance in the rooms, the acoustic effects of different absorbent panels, size of openings in the glass wall and application of double wall are investigated.
5.1 Dominant transmission paths
To understand how sound is transmitted and distributed in the system, the main paths through which the acoustic power is transmitted from the source room to receiving room are studied. The energy flow between subsystems is a non-straightforward measurable output in the experiments. However, it provides very useful information to improve the vibro-acoustic design. Only the paths with major exchange of flow power are plotted in Fig. 10.
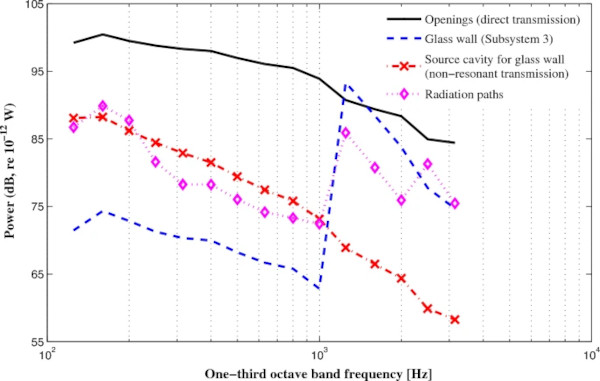
Figure 10 shows that the path with a maximum power flow at the frequency ranges from 125 to 1000 Hz and 2000 to 3150 Hz is the openings path, and the frequency ranges from 1250 to 1600 Hz the with a maximum power flow is the Glass wall (subsystem 3). Other paths that also provide an important amount of the power flow are the source cavity for glass wall (non-resonant according to the mass law) and path called radiation paths, which is the sum of all the power of the paths going from the rectangular plates of receiving room. This represents the addition of the power radiated by the subsystems 1, 4, 6, 7, 10, 11, 12, 14, 15 and 16 to the receiving cavity. Therefore, it can be concluded that most of the acoustic power is transmitted through the openings that are found in the glass wall, reducing the acoustic insulation capacity of the rooms.
5.2 Flanking paths
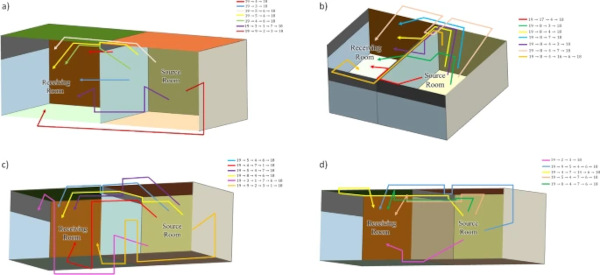
The SEA model not only predicts direct sound transmission through a wall that separates adjacent rooms, it also provides the transmission through other elements such as side walls, floors or ceilings, referred to as flanking paths. The validated SEA model is used to estimate the flanking paths from walls of the source room to receiving room walls. To simplify the calculation, only the direct connection that exists between the subsystems was considered. The analysis is carried out with all possible transmission paths which involves 3, 4, 5 and 6 subsystems, then the most dominant paths are plotted in Fig. 11 and illustrated according to the direction and excitation shown in Fig. 12.
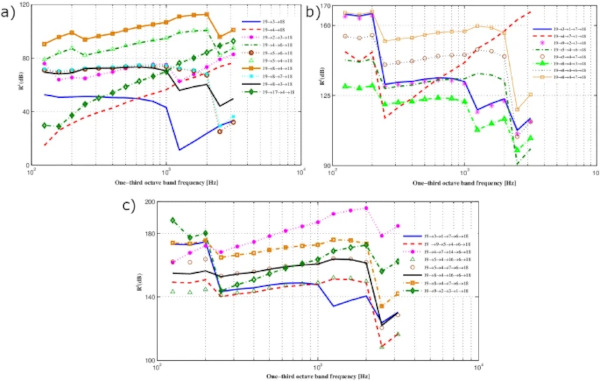
Figure 11a shows the dominant paths that involves 4 subsystems, where the path 19→8→4→18 is larger than the other paths in the frequency range from 125 to 3150 Hz. This is illustrated in Fig. 12c. For 5 subsystems the path 19→8→4→7→18 and 19→4→7→1→18 presents the highest amplitude in a frequency range from 125 to 1600 Hz and 2000 to 3150 Hz, as shown in Fig. 11b. These paths are illustrated in Fig. 12b and c, respectively.
Figure 11c shows the dominant paths for 6 subsystems, where the path 19→4→7→14→6→18 presents the highest amplitude in a frequency range from 315 to 3150 Hz and the path 19→9→2→3→1→18 presents its highest amplitude in a frequency range from 125 to 250 Hz, these are illustrated in Fig. 12d and c, respectively.
Based on the results obtained, it was identified that the subsystems with numbers 1, 2, 3, 4, 6, 7, 8, 9 and 19 are involved in the dominant flanking paths. Therefore, airborne sound insulation could be increased by increasing the mass or the loss factor of the aforementioned subsystems and adding porous material to the rooms reduce the strength of paths.
5.3 Effect of absorbing materials on reverberation time and noise reduction in the rooms
The main goal of this section is to study the effect on the reduction of reverberation time in rooms that are using different absorption materials. The appropriate materials and suitable absorption areas are identified to achieve the reverberation times recommended for each room. The added absorption material also results in changes in SPL levels (decreased) in both rooms, this difference is referred to as noise reduction. The noise reduction generated by these different materials is also studied, this is estimated with the SEA models. This study provides useful information for better selection of material and adequate absorption area.
The reverberation time of each room does not comply with the values recommended by the regulations mentioned above (World Health Organization - WHO 2001). This loss of energy over time in the room is caused by the reflection of sound according with the absorption coefficients of the surface of each room. To reduce the reverberation time of each room, it is necessary to add sound absorption material to the walls or ceiling of the rooms, for which several simulations with different materials have been carried out to select the appropriate absorbent material, this will also allow identify the adequate absorption area.
To check the performance of different absorbing materials in the rooms, it is necessary to obtain the absorption coefficient of the absorbing material. Considering parameters such as cost, weight, resistant, design and mounting easiness, the authors suggest studying the following materials: rigid fiberglass (with a thickness of 25.4 mm); PET wool (with a thickness of 20 mm); soft fibrous (with a thickness of 50 mm); polyester fibre (with a thickness of 30 mm).
For material 1 (rigid fiberglass) and material 2 (PET wool) their absorption coefficients are provided by experimental measurements carried out in a reverberation chamber, the results are shown in Fig. 11. On the other hand, the absorption coefficients of material 3 (soft fibrous) and material 4 (polyester fibre) can be determined by the air flow of material and are calculated by the relation (Jiménez et al. 2018)
In the case of a rigid passive absorber the surface impedance ZS is given by Allard and Atalla (2009)
![]()
where ZC is the characteristic impedance of the abortion material and kc is the propagation constant and d is the thickness of the material layer. ZC and kC values are obtained using the Delany and Bazley relations (Allard and Atalla 2009), are given by
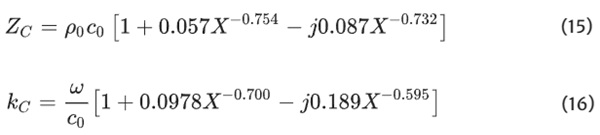
where X is a dimensionless parameter equal to
![]()
σc being air flow resistivity of the material. The properties of the material 3 and 4 are given in Table 3. The acoustic coefficient absorption calculations are obtained at frequency range from 100 to 3150 Hz in third-octave bands before plotting the results in Fig. 13.
Table 3 The parameters used to calculate the acoustic absorption coefficient of material 3 and 4 - Full size table
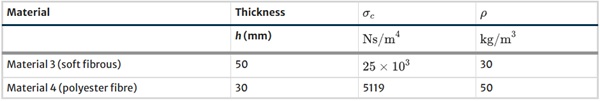
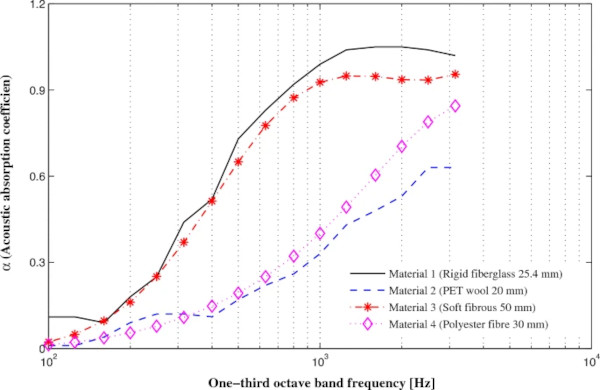
Figure 13 shows a comparison of the absorption coefficient between the four different materials, where a similar tendency can be observed in the absorption curve of material 1 and 3, the same for material 2 and 4.
To identify the optimal absorption area of each material that improves the reverberation time of the rooms and complies with the recommendations suggested by the previously mentioned regulations, several values of reverberant time are computed using the absorption coefficients of the Fig. 13 and different sizes absorption area, by means of the Sabine’s equation (Fothergill 1982)

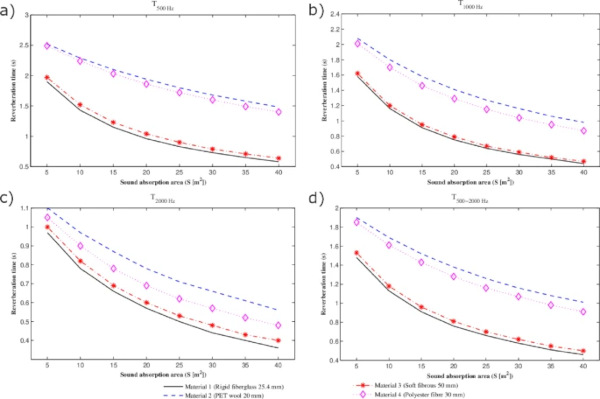
in which Vi is the volume of the room and ΣSiαi is the sum of the product of the surface areas and their respective absorption coefficients. According to the regulations (World Health Organization - WHO 2001), the reverberation times were calculated at the frequencies of 500, 1000, 2000 Hz and finally the arithmetic mean of these frequencies is obtained. The results for both rooms are obtained using an absorption area from 5 to 40 m² (40 m² is the maximum area that can be used in both rooms without affecting its functionality and aesthetic appearance) and plotted in Figs. 14 and 15.
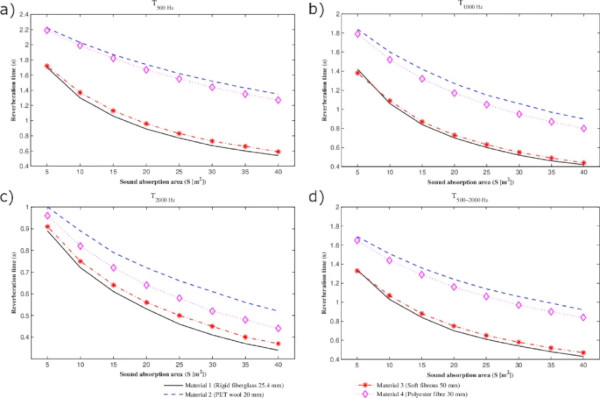
The results shown in Figs. 14 and 15 include the measured initial of reverberation time from Fig. 7. Comparing the RT values resulting in receiving room for the frequency of 500 Hz, in the Fig. 14a to maintain a time below 0.8 s, an absorption area of 25 m² is necessary for material 1 and 3, however, for material 2 and 4 an area greater than the established maximum is needed. For the frequency of 1000 Hz an area of 15, 40, 15 and 40 m² is necessary, respectively, as shown in the Fig. 14b. The results on Fig. 14c for frequency of 2000 Hz show that an area 10, 20, 10 and 15 m² is necessary, respectively. Based on the results obtained in the Fig. 14d, it can be deduced that to improve the acoustic field and comply with the arithmetic mean of the recommended reverberation time T₅₀₀₋₂₀₀₀Hz, a minimum area of 20 m² is needed with material 1, an area greater than 40 m² with material 2, a minimum area of 20 m² with material 3, and a minimum area of 40 m² with material 4.
The RT values resulting in source room are like those obtained in the receiving room, as can be seen in the Fig. 15, due to the small volume variation. Therefore, materials 1 and 3 with an absorption area of 25 m², respectively, are suitable for these rooms and comply with the recommended ranges of RT. Another improvement investigated was the change of noise reduction by adding different materials and absorption areas using the SEA models. For each iteration with the SEA models, it was considered the same absorption area in both rooms from 5 to 40 m² and four absorption coefficients of different materials suggested by the authors, shown in Fig. 13. The results shown in Figs. 14 and 15 are used to estimate the loss factor of the acoustic material to add in each room. The sum of the product of the surface areas and their respective absorption coefficients ΣSiαi is used to compute the loss factor of the acoustic rooms in the SEA models, as Craik (1996)
The NR were computed with both SEA models. Although SEA model 2 achieves a better agreement with the experimental data, another proposal to improve the sound insulation capacity between rooms is removing the aperture transmission mechanism, which is not considered in SEA model 1. Therefore, the NR is quantified without openings transmission mechanism and adding acoustic material with SEA model 1 and with SEA model 2 only adding acoustic material.
Considering absorbing material in the SEA model could affect the assumption of diffuse fields in the subsystems, especially in the receiving and source room. Therefore, it is necessary to guarantee fulfillment of the diffuse field assumption in the SEA model by verifying the normalized attenuation factor (m¯<1). It is still satisfied for all the subsystems in the frequency range of interest.
With the same computation process using the SEA models described in the Sect. 3, the NR predictions results are obtained within a frequency range from 125 to 3150 Hz in one-third octave bands for each iteration with the models.
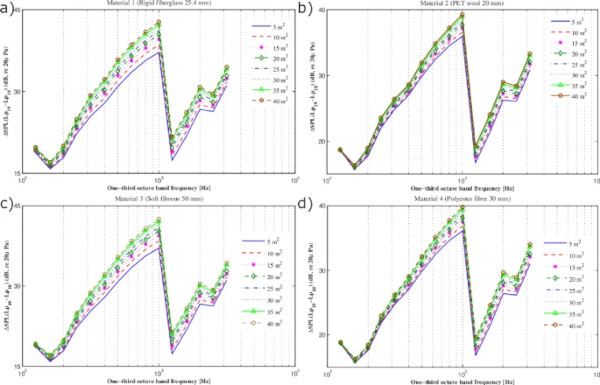
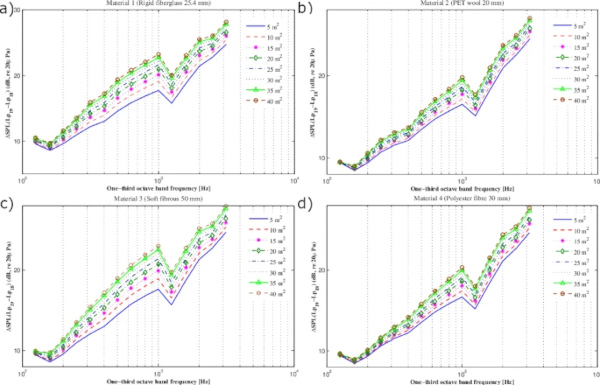
Figures 16 and 17 shows the NR predictions results between two rooms separated by a glass wall with different acoustical materials inside of the rooms. When removing the openings transmission mechanism and adding acoustic material inside of the rooms, the modification of the Δ(SPL) is important, with a maximum increase of 26 dB at 1000 Hz with an area of 40 m² for material 1 and 3. For material 2 and 4, a maximum increase of 22.7 and 23 dB in Δ(SPL) at 100 Hz is obtained with area of 40 m², respectively. Figure 17 shows the NR results when only adding acoustic material inside of the rooms, which present a maximum increase in Δ(SPL) of 6.5 dB with an area of 40 m² for material 1 and 3, for material 2 and 4 an increase of 3 dB in Δ(SPL) is obtained with an area of 40 m².
This shows the influence of this transmission mechanism in sound insulation capacity. However, despite the significant improvement in acoustic insulation between rooms (when removing the openings transmission mechanism and adding acoustic material), the recommended insulation value is not reached. Based on Figs. 14, 15, 16, and 17, and other investigations (Russo and Ruggiero 2019), a panel arrangement is proposed using material 1 with absorption area of 25 m² in both work rooms, which is shown in Fig. 18. This configuration showed the best results in terms of RT reduction and nose reduction, also are considering factors such as is a good visibility of the teacher from all listening positions, maintaining the aesthetic appearance, guarantees a good direct transmission of the voice.
5.4 Effect of openings on sound insulation between rooms.
Based on the model predictions, the openings are identified as the most contributing sound transmission path, so their sensitivity and effect on the sound insulation between rooms is quantified by means of the SEA model 2. This transmission mechanisms depends mainly on width (β) and length of the slit (opening). For the prediction shown above, the transmission loss for the openings array is based on the model provided by Gomperts and Kihlman (1967). To check sound insulation sensitivity by the estimation of this parameter, different simulations are carried out by changing the size of the opening width of 0.5, 1, 2, 3 and 4 mm.
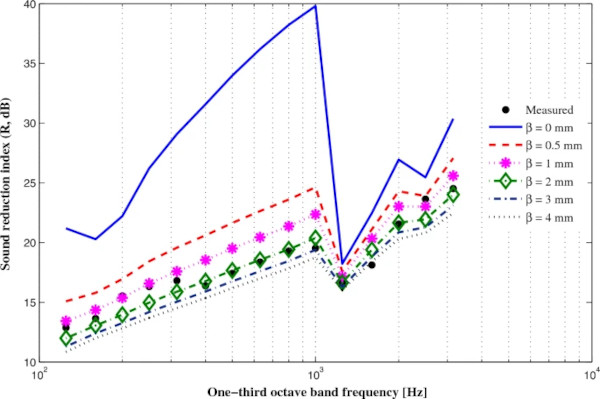
The results are shown in Fig. 19. The SRI prediction results using an opening width of 2 mm shown a better agreement with measured data. However, when the prediction without openings is compared whit measured data, the modification of the SRI is important mainly in frequency range from 125 to 1000 Hz and 1600 to 3150 with maximum difference of 24.9 dB and 6.7 dB, respectively. The results show the influence of this transmission mechanism on the insulation capacity between rooms and how it decreases when the width of the opening increases.
5.5 Effect of application of double wall on sound insulation between rooms.
Another method to increase the acoustic isolation capacity of the enclosures is the application of a double wall between the rooms, since isolating effect of the air cavity located between the two leaves of a double wall helps to reduce sound transmission between rooms. The influence and effect on acoustic insulation when applying a double wall between the work rooms by means of a SEA model is studied.
The modeling of double walls using SEA has been studied in Craik (2003), Craik and Smith (2000), and Díaz-Cereceda et al. (2013), obtaining good results and a modeling methodology of this system. Based on the sound transmission modeling process presented in Díaz-Cereceda et al. (2013), where the air cavity between leaves of double wall is treated as a connecting device and a SEA subsystem is considered here. The configuration of the double wall was applied preserving the current design and style of the rooms, fixing a leaf at each end of subsystem 4, generating an air cavity between the leaves, it is also used same material (glass) and dimensions of subsystem 3. The double wall between rooms is represented in Fig. 20.
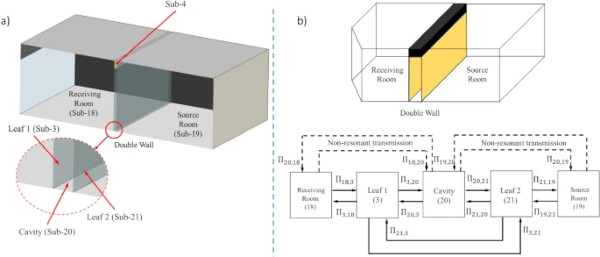
Using the SEA model 1 as a basis (where direct transmission through openings are not considered, as described in Sect. 3), a new SEA model is reformulated adding two subsystems, obtaining a model with a total of 21 subsystems (18 structural subsystem and 3 acoustic subsystems). The leaf 1 and leaf 2 of double wall are indicated with subsystem number 3 and 21, finally the air cavity between the leaves is indicated as subsystem number 20.
In this case study, the absorption in the air cavity (subsystem 20) is αcav=0. The material and geometric properties of double wall are summarized in Tables 1 and 4.
Table 4 Geometric properties of double glass wall - Full size table
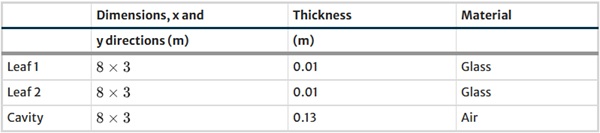
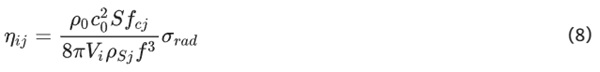
A very important transmission path in the model is the sound transmission through double wall from source room to receiving room. It is done considering the air cavity as a connecting device and as a subsystem, a sketch is provided in Fig. 20b. The CLF between each leaf and the adjacent room have been obtained with Eq. (8).
When the air cavity is treated as a SEA subsystem, the SEA parameters for acoustic cavity are obtained as described in Sect. 3. Then, the coupling loss factors between the cavity and the leaves are obtained as Díaz-Cereceda et al. (2013)
For the consideration of the air cavity as a connection between the two leaves as shown in Fig. 20. The leaf 1 is linked to the leaf 2 by means a spring with stiffness generated by the air cavity and coupling loss factor is computed by analogy with an electrical circuit (Hopkins 2012), is given by
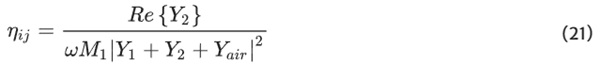
In Eq. (21),
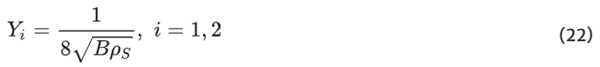
is the point mobility of each leaf, M₁ is the mass of leaf 1,
is the mobility of air cavity, where Kair is air cavity stiffness and can be computed as proposed in Díaz-Cereceda et al. (2013)
where H is the thickness of the cavity. This approach considers the non-resonant transmission caused by the stiffness of the air (Díaz-Cereceda et al. 2013). Finally, to provide non-resonant transmission between rooms and air cavity in the model, the CLF is calculated as described in Sect. 3 using the Eq. (10).
The SRI calculations using the SEA model and Eq. (3) were obtained within a frequency range from 125 to 3150 Hz in one third-octave frequency bands and with predicted data the value RW is calculated.
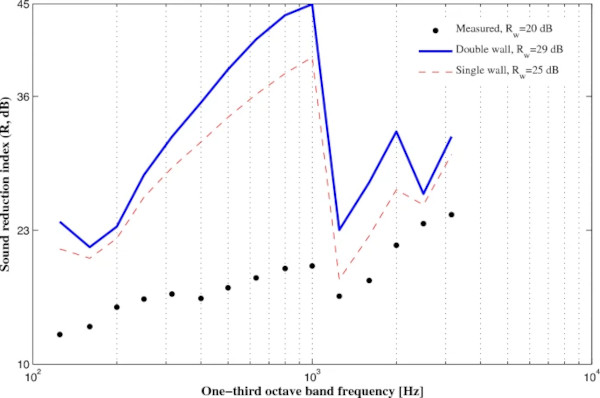
The comparison of SRI predictions results between two rooms separated by a double wall and by a single wall are shown in Fig. 21. The influence of double wall on sound insulation between rooms is very significant. The modification of the RW is important, with a maximum increase of 9 dB and 4 dB with respect to measured data and single wall prediction, respectively. This increase is mainly seen in the frequency range from 200 to 2000 Hz.
6 Conclusion
SEA models have been developed to predict sound insulation between two rooms separated by a glass wall. In this work several transmission and radiation mechanisms are considered: non-resonant transmission and a direct transmission through opening arrays and structural connections. The loss factors in the SEA room models are characterized experimentally by means of their reverberant time decay. Authors found that the average difference between the SEA model prediction and the physical measurements, in the case of model 2, measured in one third octave bands, was of 1.7 dB.
The main conclusions that can be obtained from this research work are as follows:
- There is a good correlation between the simulation results and the measured data. This is shown in Fig. 9 with SEA Model 2, where direct transmission between rooms through openings is considered. The agreement is good within a frequency range from 125 to 3150 Hz. This good agreement could be explained by the fact that the SEA hypotheses are fully satisfied in such frequency range. It is also to mention that the attenuation factor guarantees fulfillment of the diffuse field assumption in the SEA model, which is very important for SRI predictions.
- The most critical paths, in terms of the sound transmission to the source room, take place through the openings in the glass wall that separates the rooms. This is the dominant path at almost all the frequencies, when the two adjacent work rooms configurations are used. The main transmission paths help to identify the most significant parameters and dimensions of the rooms being studied. As it was shown in this paper, the accurate determination of these parameters affects the ultimate vibro-acoustic performance of the work rooms.
- It was also found that there are not very large differences between most workspace designs. It means that some of the knowledge gained in the present analysis could be used to improve other designs. For example, the relative importance of the paths must not be very different between models, so it means that a key aspect is the proper design of the wall between the rooms, increasing the acoustic isolation capacity of the enclosures. Rooms building materials are widely used, such as glass and plasterboard, which can provide a high sound reflection in the spaces and generate an inadequate reverberation time for conferences and educational purposes.
- SEA can be used to correctly design rooms that comply with recommended acoustic standards. This method helps in quantifying noise reduction, sound transmission and reverberation time, which improve acoustic performance for rooms that are used for teaching. In this case study, it was demonstrated that SEA analysis helped in designing a room configuration that uses double wall glass between rooms, uses no openings in the joints between the panels, and employs an arrangement of absorbing panels using the material 1 with an area of 25 m2 in both work rooms (shown in Fig. 18). These design changes resulted in an increase of weighted sound reduction index between rooms in 9 dB, with respect to measured data and also maintaining a reverberant time below 0.8 s. Lastly, the above significantly improved acoustic performance of the two adjacent workspaces without the need to carry out structural changes, providing an adequate acoustic environment for conferences and educational purposes.
- The validated SEA model is used to estimate the flanking paths between two adjacent workrooms separated by a glass wall. The results obtained in Fig. 11 indicate that the most dominant flanking paths are 19→8→4→18, 19→8→4→7→18, 19→4→7→1→18, 19→4→7→14→6→18 and 19→9→2→3→1→18. All these paths are illustrated in the Fig. 12 to clarify the direction of each transmission path and the subsystems involved (subsystems number 1, 2, 3, 4, 6, 7, 8, 9 and 19, respectively). These paths provide useful information for noise control and also increase airborne sound insulation between rooms.