Author: Gabriel Neves Alves Ferreira
Source: International Journal of Structural Glass and Advanced Materials Research, 2022, 23-32, Science Publications
DOI: https://doi.org/10.3844/sgamrsp.2022.23.32
Abstract
This article proposes a methodology for the structural design of multi-layered glass beams considering lateral-torsional buckling. The basis is the use of two separate effective thicknesses to determine flexural and torsional rigidities, based respectively on the Enhanced Effective Thickness (EET) and sandwich theory. Analytical formulae are then used to calculate the elastic critical bending moment and a design curve is developed based on numerical results. The proposed methodology yields reliable results for the structural design of glass beams in a wide range of current configurations.
Introduction
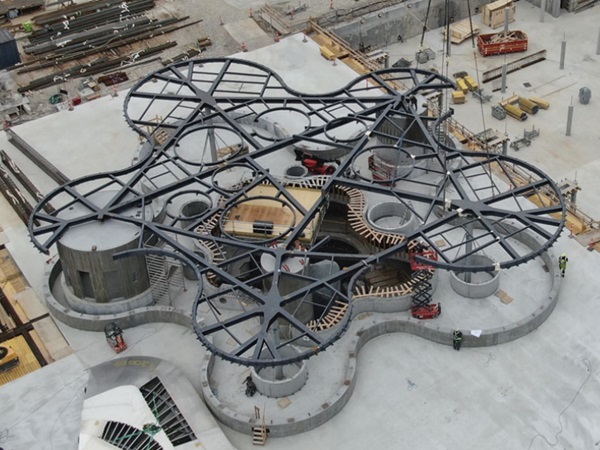
The use of glass as a construction material has surged in recent years due to its architectural appeal and a better understanding of its mechanical behavior. Glass beams are becoming more current, both for stiffening façades and as a structural element in skylights. In this context, the use of laminated glass is now broadly considered the best practice for security and redundancy reasons.
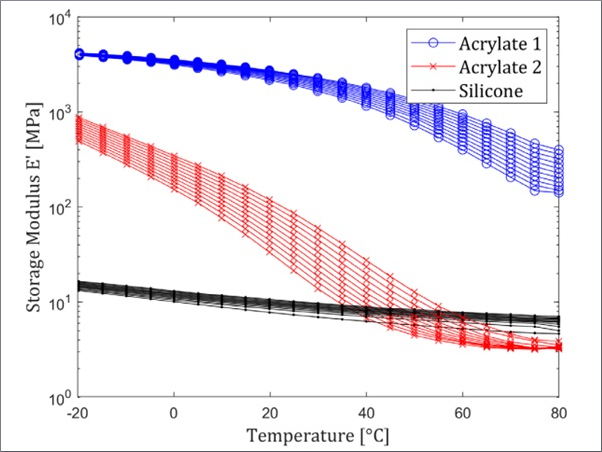
Interlayers used in the fabrication of laminated glass are polymers, whose mechanical behavior is viscoelastic and depends on temperature. In out-of-plane bending, the main function of the interlayer is to transfer shear stresses between the glass layers. This transfer is governed by the shear modulus of the interlayer, which in turn is temperature and time-dependent. The geometry and boundary conditions of the panel also play an important role in the effectiveness of shear coupling.
Due to the high slenderness of glass beams, the analysis of instability in the form of Lateral-Torsional (LT) buckling is critical in determining the resistance in the Ultimate Limit State (ULS). Considering the initial imperfection of the beam is crucial because it has a major influence on the structural behavior of the element. A precise analysis of this behavior can be long and unpractical since a fully nonlinear model is needed to correctly assess the stresses produced. For a laminated glass beam, the multi-layered composition complicates it, even more, the analysis. A finite element model with solid elements is often employed, but multi-layer shell elements are also sometimes used.
In several standards and codes, a design curve is used for this kind of problem. It is the case of Eurocode 3 (CEN, 2005) for steel columns and beams. Design curves provide a framework for simple and reliable design practice without the need to make use of more complex numerical modeling.
In the context of the development of a Eurocode for structural glass (Feldmann et al., 2014), the definition of a design methodology for laminated glass beams is important to allow for broader usage of these elements in construction projects.
Some propositions for design curves for monolithic and laminated glass with 2 glass layers can be found in the works by Luible and Crisinel (2006); Bedon and Amadio (2015). The first work uses the Eurocode 3 curve “c” and the latter proposes a less conservative curve. However, these curves proved to be insufficient when analyzing multi-layered laminates, as shown later in this study.
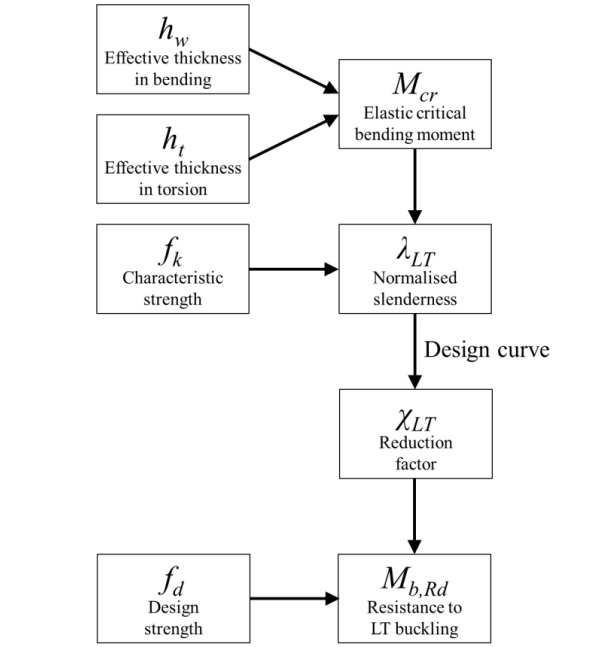
To tackle this problem and contribute to the development of structural analysis of multi-layered glass beams, this article proposes a verification procedure that comprehends the analytical computation of the critical moment and an appropriate design curve. The steps of this procedure, using a framework based on the Eurocodes, are shown in Fig. 1.
Validation of the proposition is provided through comparisons with numerical models. The applicability and limitations of the methodology are also discussed.
In the scope of this article, only the case of a laminated beam composed of glass layers of equal thickness is addressed. Some direct possibilities for the extension of the methodology are also indicated.
Determination of the Elastic Critical Bending Moment
The determination of the elastic critical bending moment is the first step in the design process of beams subject to LT buckling. Different methods can be found in the literature and design codes.
For example, the Italian guide CNR-DT 210 (CNR, 2013) provides formulas for monolithic and laminated glass with 2 glass layers for different types of moment distribution: Constant, triangular, parabolic, and bilinear (with zero at the mid-point for the latter). However, two shortcomings arise. First, the position of the loading is not taken into account, which significantly impairs accuracy. Also, laminated glass is limited to two glass layers. The guide uses the Wölfel-Bennison model (Bennison et al., 2008) for effective thickness in both bending and torsion, which is a source of imprecision.
The Australian standard AS 1288 (Standards Australia, 2008) also covers the problem, presenting a more complete set of loading cases and boundary conditions, some of which are shown next. However, the modeling of laminated glass is overly simplified into short- or long-term loads, neglecting several important factors such as the mechanical properties of the interlayer, temperature, or geometrical configuration.
The equations shown here are presented in AS 1288 and Nethercot and Rockey (1973), which have proven accurate for monolithic glass beams. But two different values of effective thickness are now used: One for lateral bending and another one for torsional rigidity.
Formulae for the Elastic Critical Bending Moment
The following formula, presented in AS 1288, is used to calculate the elastic critical bending moment for a beam with no intermediate lateral supports:
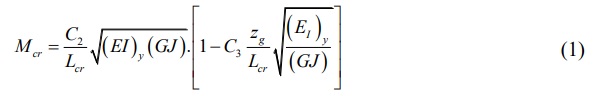
where:
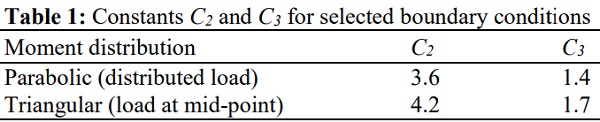
C₂ and C₃ = Constants depending on boundary conditions (Table 1)
Lcr = The distance between lateral restraints
(EI)y = The lateral flexural rigidity
(GJ) = The torsional rigidity
zg = The height above centroid of the point of load application
It is important to notice that zg has a sign. A positive zg value corresponds to a destabilizing load such as a downward load applied on the top of the beam. Alternatively, when the position of load application has a stabilizing effect (such as a downward load applied at the bottom of the beam), zg is negative.
Shear transmission between glass layers is complex and hard to account for analytically. Most importantly, it is produced in a very different manner whether laminated glass is subject to bending or torsion. Therefore, two effective thickness approaches are employed: One for bending and one for torsion. For laminated glass, the rigidities are then calculated as follows:
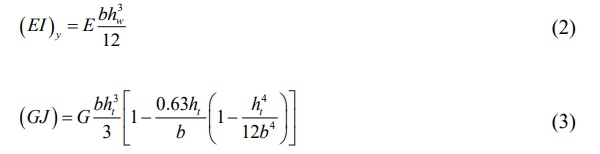
where:
hw = The effective thickness in lateral bending
ht = The effective thickness in torsion
E = The glass young’s modulus (70.0 GPa)
G = The glass shear elastic modulus (28.5 GPa calculated from a Poisson’s ratio of ν = 0.23)
b = The height of the beam’s cross-section
Equation 3 is an approximation derived by Maddux et al. (1969). A simplification can be made by neglecting the term in brackets for very slender cross-sections (b ≫ ht).
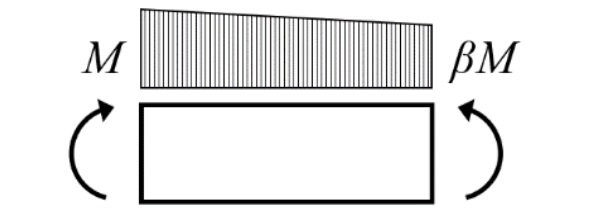
Another possible configuration is a beam with intermediate lateral supports, for which the elastic critical moment can be calculated with Eq. 4, adapted from Nethercot and Rockey (1971). The expression considers a beam with linearly varying bending moment with lateral displacement blocked at both ends. This expression should be used with caution, since it does not take into account the position of the load application and the moment is considered to vary linearly:

where:
β = Defined in Fig. 2
Effective Thickness in Lateral Bending
For the out-of-plane bending of laminated glass beams, Galuppi and Royer-Carfagni (2014) proposed the Enhanced Effective Thickness (EET) method, which is able to evaluate the flexural behavior of multi-layered laminate glass beams with good accuracy. This method is also present in CNR-DT 210 for out-of-plane bending.
Other than the case outlined here (for N glass layers of equal thickness), the method has also been developed for beams with 2 or 3 layers of any thickness and plates with 2 glass layers. It can also be promptly extrapolated for plates with 3 glass layers or N glass layers of equal thickness.
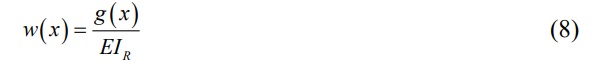
The model is based on the hypothesis of small deformations and the role of the interlayer is limited to the transmission of shear between glass layers. The whole kinematics of the problem is described only by the global out-of-plane displacement w(x) and the axial (in-plane) displacements of each glass layer ui(x).
The moment of inertia of the laminated cross-section lies between two limit states:
- the monolithic upper limit (where the interlayer is perfectly stiff and transmission of shear is total)
- the lower limit where the interlayer does not transmit shear (the total inertia is the sum of the individual moments of inertia of each glass layer)

where:
IR = The resulting moment of inertia
Itot = The moment of inertia for the monolithic upper limit
Ii = The moment of inertia for each glass layer
η = The coefficient of shear coupling in bending
hi = The thickness of the glass layers
di = The distance between the center of gravity of each glass layer to the center of gravity of the laminated cross-section
The coefficient η is responsible for defining where the flexural stiffness lies between the two limits. When its value is zero, the glass layers are free to slide over each other; when its equal to 1, the shear coupling is complete. Galuppi and Royer-Carfagni (2014) derive this coefficient by a variational approach, minimizing the total energy of the system for a given shape function g(x).
For a laminated beam composed of N glass layers of equal thickness h and with an interlayer thickness of t, the coefficient of shear coupling in bending is determined as follows (CNR, 2013):
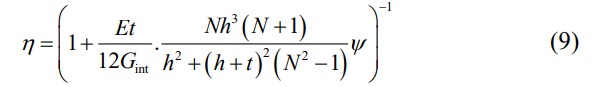
where:
Gint = The elastic shear modulus of the interlayer
Ψ = A coefficient that depends on geometry, loading form, and boundary conditions
For the buckling problem, a sinusoidal shape function is considered:

According to Galuppi and Royer-Carfagni (2014) and using this shape function, the coefficient Ψ is then calculated as:

Finally, the effective thickness in bending is given by:

This effective thickness is then used in Eq. 2 to determine the lateral flexural rigidity of the laminated glass beam. The effective thickness for determining the stresses acting on each glass layer is not shown here because it does not influence the instability phenomenon.
Effective Thickness in Torsion
Costa (2015) presents a method for determining the torsional stiffness of a laminated glass beam through the following expression:
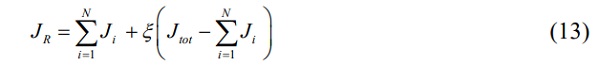
where:
JR = The resulting torsion constant
Jtot = The torsion constant for the monolithic upper limit
Ji = The torsion constant for each glass layer
ξ = The coefficient of shear coupling in torsion
The coefficient ξ is provided by the author for beams with 2 layers of any thickness and symmetrical beams with 3, 4, or 5 glass layers. The formulation assumes that b ≫ h and the development is made through the equilibrium of efforts in the cross-section, based on sandwich theory.
For the special case of equal thickness for all layers, the following adapted expression is derived:

It is then possible to deduce an effective thickness in torsion, that can then be used in Eq. 3:

Results and Validation
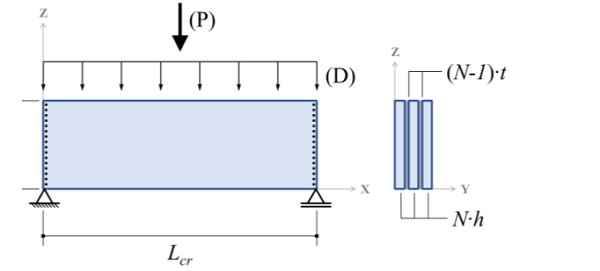
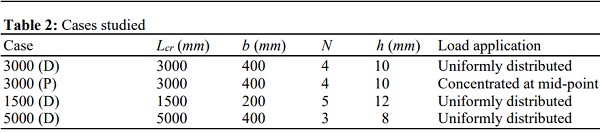
Some examples have been constructed to evaluate the precision of the elastic critical bending moment calculated using Eq. 1, 2, 3, 12, and 16. A beam simply supported at each extremity was analyzed for the configurations presented in Table 2 (Fig. 3 for the scheme). Lateral displacements and torsion are blocked at each extremity.
The shear modulus of the interlayer (Gint) varies from 0.01 MPa up to 1000 MPa, considering the present state of commercially available materials. The interlayer thickness is always the same, t = 1.52 mm. In all the cases the load points downwards and it is applied at the top of the beam (zg = + b/2).
These cases were chosen to encompass the analysis of beams with diverse slenderness, cross-section forms, and numbers of layers. Also, the influence of the way the load is applied can be evaluated.
For comparison, numerical results were obtained through Finite Element Analysis (FEA) using Code Aster (Salome-Meca, 2021). The models use solid quadratic hexahedral elements to calculate the elastic critical bending moment, which corresponds to the first mode of elastic instability. One element is used for the thickness of each layer of glass and each interlayer. Convergence tests were made to ensure that the discretization is precise enough.
The distributed loads (D) were applied as downward surface loads on top of the glass layers. For the concentrated load case (P), the loads were solely applied to the elements at mid-span. Boundary conditions were applied as linear displacement restrictions on glass edges corresponding to the supports represented in Fig. 3. For displacements in the X direction, a single node was fixed to ensure static equilibrium.
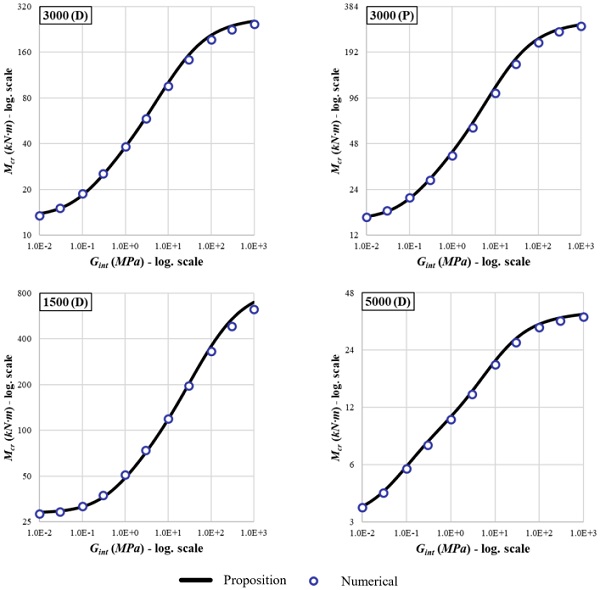

The proposal correctly captures the evolution of critical bending moments for all configurations. Figure 4 shows the results obtained and the accuracy for each case is evaluated in Table 3. It shows very good precision for lower values of Gint and is slightly less accurate for higher values of Gint.
Definition of a Design Curve
In the real world, structural elements are never perfectly straight or aligned. Thus, the importance of considering initial imperfections, which play a large role in the LT buckling of beams.
A design curve is constructed based on a given initial imperfection. The value of w₀ = Lcr/300 is adopted, based on the recommendation for fully-tempered glass given in Feldmann et al. (2014). This value is consistent with tolerances found in brochures of different glass suppliers. Even though annealed, heat-strengthened, and fully tempered glass may present different deformations due to fabrication, it is preferable to consider a unique value so that the design procedure is clearer and more consistent. Taking Lcr/300 for all types of glass is on the safe side.
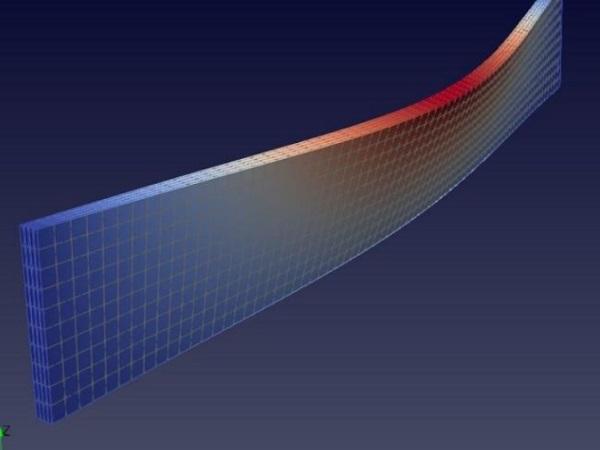
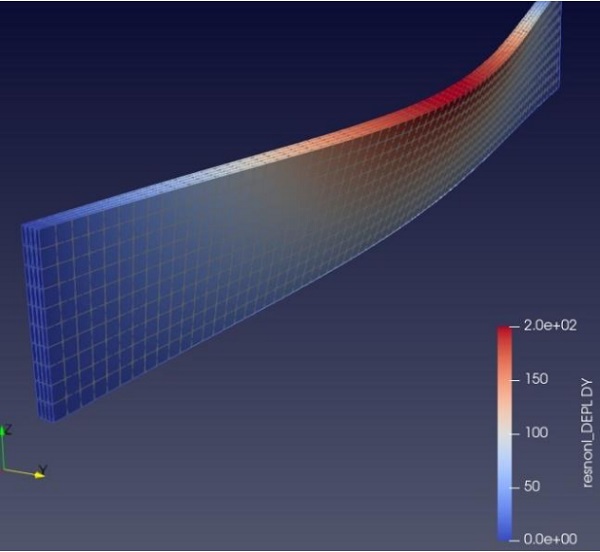
Numerical Modelling
Through FEA, incremental non-linear models were implemented (Fig. 5), with the hypothesis of large displacements and large deformations being applied. The same cases presented in Table 2 were used, with an initial imperfection corresponding to the shape of the first LT buckling mode with a maximal amplitude of w₀ = Lcr/300. This was achieved by defining the initial geometry of the non-linear model as the deformed shape obtained from the elastic instability analysis described in the previous section. The model was also constructed with solid quadratic hexahedral elements and the same boundary conditions as before were applied.
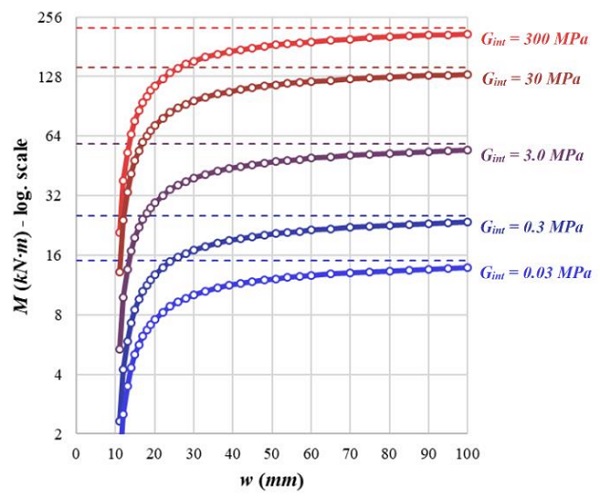
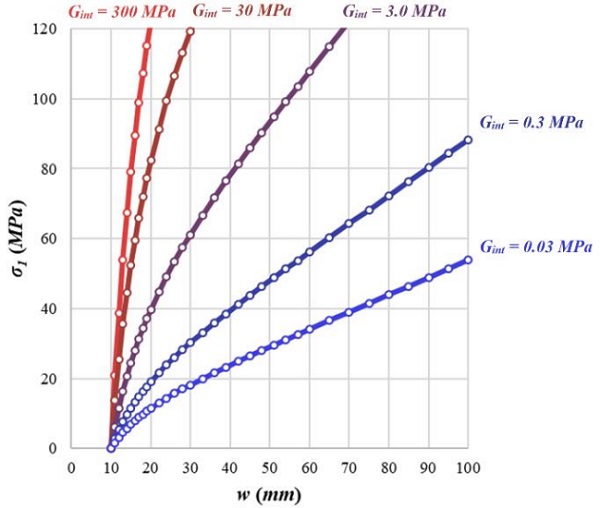
For each case, different values of Gint were considered: 0.03, 0.3, 3.0, 30, and 300 MPa. The resulting bending moment, maximum principal stress, and lateral displacement were computed for each load increment.
Results for case 3000 (D) are shown here for illustrative purposes. The critical bending moment was also plotted in dashed lines for each value of Gint. It is possible to see how the bending moment tends to the critical moment as the lateral displacement increases due to the applied load (Fig. 6). The role of the interlayer stiffness in the resulting stresses can be seen in Fig. 7. Similar results were obtained for the other cases – 3000 (P), 1500 (D) and 5000 (D).
To compute glass resistance, equations based on EN 16612 (CEN, 2019) are used:

where:
fd = The design value of the bending strength
fk = The characteristic value of the bending strength
fgk,0 = The instantaneous characteristic value of the bending strength for annealed glass (45 MPa)
fbk,0 = The instantaneous characteristic value of the bending strength for prestressed glass (45 MPa for annealed glass, 70 MPa for heat-strengthened glass, and 120 MPa for fully-tempered glass)
kmod = The factor for load duration
γMA = The partial factor for annealed glass (1.8)
γMv = The partial factor for surface prestress (1.2)
Coefficients related to edge condition, surface treatment, and heat treatment position have been omitted. This means that polished edges, surface as produced, and horizontal heat treatment were considered. These factors do affect the bending strength and must be accounted for in design (more complete versions of Eq. 17 and 18 can be found on EN 16612). The choice for these edge and surface conditions was made since they are better suited for use in glass beams. A different design curve may be needed if these conditions change.
The factor kmod has an important role in the determination of strength, for it encapsulates the subcritical crack propagation that takes place over time when glass is submitted to traction stress on the surface (Wiederhorn and Bolz, 1970; Charles, 1958).
Loading duration of 3 sec, 10 min, 3 weeks, and 50 years were considered. They correspond, respectively, to kmod values of 1.0, 0.74, 0.45, and 0.29 according to EN 16612. For glass resistance, the values of fbk,0 for annealed (45 MPa), heat-strengthened (70 MPa), and fully tempered glass (120 MPa) were considered. Different values of characteristic strength were then computed using Eq. 18 with these values of kmod and fbk,0.
From the results of the nonlinear FEA models, a resistance value
![]()
was obtained as the applied bending moment that corresponds to each value of characteristic strength fk at the point of maximum principal stress acting on the glass. Some data points were discarded because they are not compatible with current commercially available materials (kmod = 0.29 was not considered when combined with Gint equal or superior to 3 MPa, and kmod = 0.45 was not combined with Gint = 300 MPa). In the end, 192 data points were generated from the finite element models.
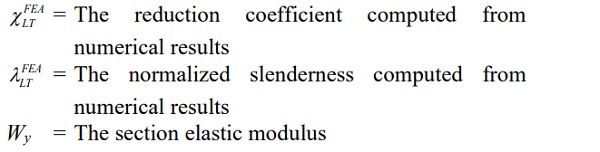
A reduction factor for LT stability was then computed for each data point using the numerical value for the corresponding elastic critical bending moment
![]()
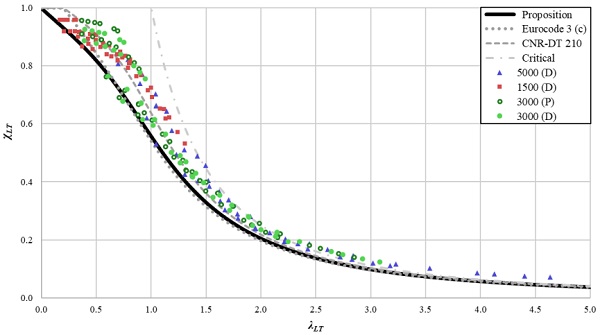
The normalized slenderness was also determined from the FEA data. The generated points are plotted in Fig. 8.

where:
Proposed Design Curve
A design curve in the same formulation as presented in Eurocode 3 or CNR-DT 210 is used and the constants α₀ and α* are chosen to best fit the data points.

with:
α₀ = 0.00
α* = 0.35
These values are a compromise between being on the safe side for the majority of the data points and not being too penalizing for most current cases. The value of α₀ is zero since even for low slenderness beams the LT buckling phenomenon is present and reduces load-bearing capacity. For the 192 data points, 96.4% stay on the safe side, and the maximum relative error of the curve in comparison with the data points is + 4.5%.
Design Methodology
Following the framework in Fig. 1, the steps in proposed the design methodology are:
- Determine the effective thickness in lateral bending hw using Eq. 9, 11 and 12
- Determine the effective thickness in torsion ht using Eq. 14-16
- Calculate the elastic critical bending moment Mcr using Eq. 1-3
- Use Eq. 23 to determine the normalized slenderness λLT
- Find the reduction factor χLT with Eq. 21 and 22
- Calculate the design moment resistance to LT buckling through Eq. 24

The values of design strength (fd) and characteristic strength (fk) can be calculated according to EN 16612. Additional coefficients must be applied to Eq. 17 and 18 if the edges are not polished or if the heat treatment is vertical instead of horizontal to account for the loss of material strength.
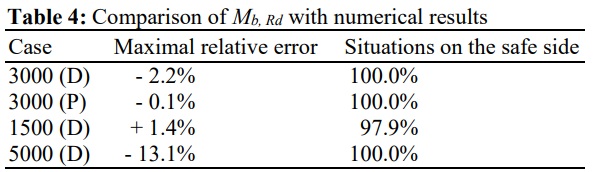
Comparison of Resistance with Numerical Models
To assess the reliability of this procedure, the design resistances determined this way were compared with the numerical results
![]()
These were obtained from the FEA results by finding the applied bending moment that corresponds to each value of design strength fd.
Again, 192 data points were generated in total. Table 4 shows that the results are in the large majority on the safe side (only one simulation yielded a result slightly above the corresponding numerical result).
Applicability and Limitations
The type of load (concentrated or distributed) did not affect the accuracy. This leads to the belief that diverse load configurations can be analyzed, provided that the global buckling mechanism is similar. The case of a beam with intermediate lateral restraints should also be applicable (using Eq. 4 to calculate the elastic critical bending moment), but further research is needed to confirm the validity of the design curve for this case.
The determination of effective thickness in bending and in torsion can also be determined for beams with 2 different glass layers and symmetrical cross-sections with 3 glass layers using the EET method (Galuppi and RoyerCarfagni, 2012 and 2014) and the sandwich formulation by Costa (2015). The methodology can be promptly adapted to encompass these arrangements.
For some applications such as consoles or beams with continuous lateral support, further research is needed to evaluate if the use of this design curve is appropriate. However, for the case of beams with continuous lateral support, the curve here proposed stays globally on the safe side in comparison with the one proposed by Luible and Schärer (2016).
Combined Loads
Glass beams are often subject to loads with different durations and related temperatures. As suggested by Bedon and Amadio (2015), the evaluation of a beam subjected to various design actions can be accessed via the following equation, which seems to be a reasonable and safe approach.
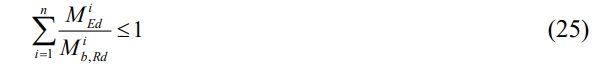
where:
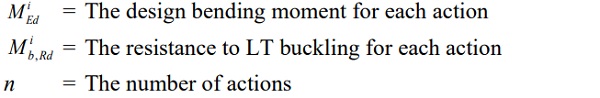
For multiple variable loads, combination coefficients must be applied according to EN 1990 (CEN, 2003).
Influence of the Initial Deformed Shape
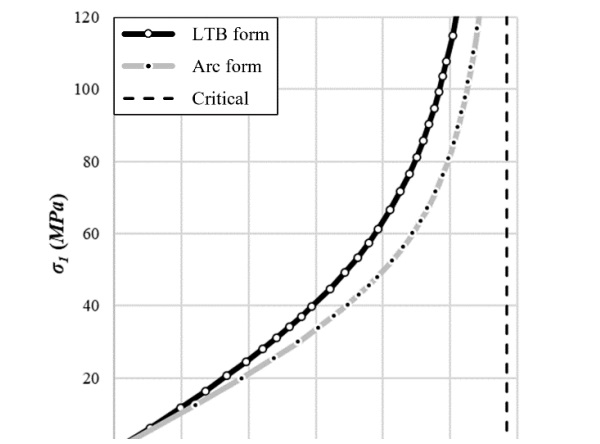
It is important to highlight the importance of initial geometry. Even for the same value of w₀, the nonlinear behavior can vary drastically depending on how the model is constructed. For the previously presented results, the shape of the first mode of elastic instability in lateral-torsional buckling (LTB) was used.
Using different shapes of initial deformation would lead to significantly different design curves. To illustrate this, a comparison was made for the 3000 (D) case with Gint = 3.0 MPa between an initial form based on the instability form and an arc form. The results of stress produced as a function of the bending moment applied are shown in Fig. 9. A difference of up to 27% is obtained between the two models.
Conclusion
The definition of a simple and reliable analysis procedure for multi-layered laminated glass beams is an important step in the process leading to the establishment of a Eurocode for the structural use of glass. This article defines a method for determining the elastic critical bending moment based on different sources found in the current literature on the subject. An appropriate design curve is also developed for multi-layered glass beams.
The proposed methodology is anchored on solid research and displayed a consistent and safe performance on the examples studied. It is easy to apprehend and implement, showing safe results when compared with more precise numerical models. It can be applied to a vast range of multi-layered laminated glass beams, also including beams with one or two glass layers.
Since the design curve was deduced considering polished edges and non-treated surface, it is only applicable to these cases.
Further research is now needed to validate and extend its application field to different structural arrangements which present different mechanisms of LT buckling, such as cantilevers and continuously restrained beams. A thorough evaluation of the effects of load combinations also constitutes an important research topic to confirm the broad validity of Eq. 25, since most design situations include multiple load cases acting at the same time.
Acknowledgment
Thanks to my family for their support and to my colleagues at Arcora for helping with the revision of this article.
Funding Information
This research was funded by Groupe Ingérop, the parent company of Arcora.
Ethics
This article is an original work and contains unpublished material. The author confirms that there is no conflict of interest.
References
Bedon, C., & Amadio, C. (2015). Design buckling curves for glass columns and beams. Proceedings of the Institution of Civil Engineers-Structures and Buildings, 168(7), 514-526. https://doi.org/10.1680/stbu.13.00113
Bennison, S. J., Qin, M. H., & Davies, P. S. (2008). High performance laminated glass for structurally efficient glazing. Innovative light-weight structures and sustainable facades, Hong Kong, 1-12.
CEN. (2003). Eurocode 0 - Eurocodes structuraux - Bases de calcul des structures. Version Française (NF EN 1990:2003). (Comité Européen de Normalisation). Association Française de Normalisation (AFNOR), La Plaine Saint-Denis, France.
CEN. (2005). Eurocode 3 - Calcul des structures en acier - Partie 1-1: Règles générales et règles pour les bâtiments. (Comité Européen de Normalisation). Version Française (NF EN 1993-1-1:2005). Association Française de Normalisation (AFNOR), La Plaine Saint-Denis, France.
CEN. (2019). Verre dans la construction - Détermination par calcul de la résistance des vitrages aux charges perpendiculaires à leur plan. (Comité Européen de Normalisation). Version Française (NF EN 16612:2019). Association Française de Normalisation (AFNOR), La Plaine Saint-Denis, France.
Charles, R. J. (1958). Static fatigue of glass. II. Journal of Applied Physics, 29(11), 1554-1560. https://doi.org/10.1063/1.1722992
CNR. (2013). Guide for the Design, Construction, and Control of Buildings with Structural Glass Elements (CNR-DT 210/2013). (Consiglio Nazionale delle Ricerche). Advisory Committee on Technical Recommendations for Construction, Rome, Italy. https://www.cnr.it/en/node/3843
Costa, M. S. L. M. (2015). Modeling of the structural behavior of laminated glass beams - Study of the lateral-torsional buckling phenomenon. Thesis to obtain the Master of Science Degree in Civil Engineering, Instituto Superior Técnico, Universidade de Lisboa, Lisboa, Portugal. https://doi.org/10.13140/RG.2.1.2201.7681
Feldmann, M., Kasper, R., Abeln, B., Cruz, P., Belis, J., & Beyer, J. (2014). Guidance for European structural design of glass components. Publications Office of the European Union, 1-196. https://doi.org/10.2788/5523
Galuppi, L., & Royer-Carfagni, G. (2014). The enhanced effective thickness of multi-layered laminated glass. Composites Part B: Engineering, 64, 202-213. https://doi.org/10.1016/j.compositesb.2014.04.018
Galuppi, L., & Royer-Carfagni, G. F. (2012). The effective thickness of laminated glass beams: New expression via a variational approach. Engineering Structures, 38, 53-67. https://doi.org/10.1016/j.engstruct.2011.12.039
Luible, A., & Crisinel, M. (2006). Lateral torsional buckling of glass beams. In Progress in Steel, Composite and Aluminium Structures–Proceedings of the XI International Conference on Metal Structures (pp. 971-978). London: Taylor & Francis. https://www.researchgate.net/publication/37455641_Lateral_torsional_buckling_of_glass_beams
Luible, A., & Schärer, D. (2016). Lateral torsional buckling of glass beams with continuous lateral support. Glass Structures & Engineering, 1(1), 153-171. https://doi.org/10.1007/s40940-016-0008-3
Maddux, G.E., Vorst, L.A., Giessler, F.J. & Moritz, T., (1969). Stress Analysis Manual. U.S. Department of Commerce, National Technical Information Service, Springfield, VA., USA. https://apps.dtic.mil/sti/pdfs/AD0759199.pdf
Nethercot, D. A., & Rockey, K. C. (1971). A unified approach to the elastic lateral buckling of beams. The Structural Engineer, Volume 49, Issue 7, (321-330). https://www.istructe.org/journal/volumes/volume49-(published-in-1971)/issue-7/a-unified-approachto-the-elastic-lateral-buckling/
Nethercot, D. A., & Rockeyk, K. C. (1973). Lateral buckling of beams with mixed end conditions. Structural Engineer, 51(4). https://trid.trb.org/view/140941
Salome-Meca. (2021). Salome-Meca for Windows 9.7.0.
https://code-aster-windows.com/download/
Standards Australia. (2006). Glass in buildings - Selection and installation (AS 1288-2006). Council of Standards Australia, Sydney, Australia. https://store.standards.org.au/product/as-1288-2006
Wiederhorn, S., & Bolz, L. H. (1970). Stress corrosion and static fatigue of glass. Journal of the American Ceramic Society, 53(10), 543-548. https://doi.org/10.1111/j.1151-2916.1970.tb15962.x


.")