.")
This paper was first presented at GPD 2023.
Link to the full GPD 2023 conference book: https://www.gpd.fi/GPD2023_proceedings_book/

Authors:
Stefan Reich* ∙ Marius Müller* ∙ Christian Pfütze* ∙ Ingo Stelzer**
*Anhalt University of Applied Sciences, Department of Architecture, Facility Management and Geoinformation, building envelope research group, 06846 Dessau, Germany.
**Kuraray Europe GmbH, Advanced Interlayer Solutions Division, 65795 Hattersheim, Germany.
Abstract
The fading effect of UV radiation on color pigments is widely known, the most common is the loss of color intensity in clothes. A high UV-resistance of window and façade glazing is urgent for the conservation and preservation of historical exhibits and interiors.
In this contribution, a long-lasting natural weather testing of several glass types, mostly LSG with different interlayer materials, and the effect of the different color patterns of paper and textile specimens are presented. According to the Harrison damage function, the initial damage level starts at 500 nm wavelength. Therefore, besides standard PVB-interlayer (UV-blocking from 360 nm wavelength) also special UV-blocking interlayer (UV-blocking from 400 nm) are part of the study. The research was conducted over the entire summer of 2021.
The assessment of the bleaching effect was measured as color difference according to the CIELAB color space and verified by human eye perception. The CIELAB color space is the most used color system and combines brightness, yellow-blue and red-green tones. The research shows a significant effect of different glass build-ups on the color difference value, especially for mediumsensitive pigment papers and textiles.
2 Introduction
The paper summarized a comprehensive study by the authors recently published (Mueller et. al., 2023).
Most substances change their properties over their lifetime and are thus affected by the natural aging process, which is caused by their respective environmental influences. However, organic ones are particularly vulnerable, but even inorganic materials are not necessarily permanent. Their material change is simply much slower. (CIE157, 2004)
Over time, a photo, a piece of furniture, or clothing begin to fade or change color. The color intensity decreases and the dark turns gray. This can end in losing any color pigment. The ultraviolet radiation that occurs naturally in sunlight plays a significant role here.
Museums and stores with carpets or clothes in shop windows in particular have to struggle with this phenomenon. When a new museum is built, there are usually no windows or only a few are arranged in such a way that no damage can occur from natural sunlight.
In the field of monument, preservation it was largely ignored. In the meantime, a change in thinking can also be observed here, because sensitive furnishings such as canvas paintings, textiles, pieces of furniture, carpets, plastics, and panel paintings suffer from the effects of radiation.
In the case of light protection systems, preference is increasingly being given directly to the glass plane. Most film-based protection systems are applied either to the existing pane or between two pane levels. Another solution is offered by functional glasses, which have direct protective properties, like tinted or coated glass panes. (Löther, T., 2021)
UV protective films, which function as a kind of roller shutter system or subsequently laminated to the window glass, are already well known and have also been tested for years to specify their long-term behavior. (Löther, T., 2021) It is relevant taking care to ensure that these films filter out up to 99% of harmful UV-A radiation, as well as light in the shortwave visible range up to 400 nm (Naumović, T., 2021).
Regarding the glazing function, predominately laminated safety glass (LSG) is applied. The build-up of LSG consists of at least one interlayer foil. the glazing that would have to be selected, laminated safety glass would be used. So, the question arises as to whether a conventional laminated safety glass can already filter out the damaging radiation dangerous for conservation goods.
2 Color fading
2.1 Photochemical processes
The energy input resulting from the incident radiation can be absorbed or reflected by the molecules. If the radiation energy is absorbed, effects such as heating and fluorescence can occur in addition to different chemical reactions, each of which leads to material damage. In general, these processes are referred to as photochemical decomposition. In order to react with another molecule, a certain minimum activation energy is required for the respective molecule. (Herzberg, H., 2014)
If the photon energy absorbed is equal to or greater than the required dissociation energy, the molecule is put into an excited state. In this state, the supplied energy can be released exothermally or fluorescently, such as transferred to another molecule. In order for the molecule to reach a lower and thus stable energy level, it is also possible that only a part of the energy is released. At a time, the remaining energy is completely released. The supplied energy can also break up molecular bonds. This results in chemical changes to the molecule. (Schaeffer, T., 2001)
More commonly, however, decomposition occurs in the form of photooxidation. Among other things, foreign molecules such as oxygen, water vapor or other pollutants are involved in this. Further surface contamination can significantly accelerate these processes. (Koesling V., 2000)
The intensity of the photochemical reactions is characterized by irradiance, exposure time, dose, and harmful effect of the respective wavelength ranges of the incident radiation, as well as the action spectrum of the irradiated substance. (CIE157, 2004)
2.2 Color change depending on irradiation
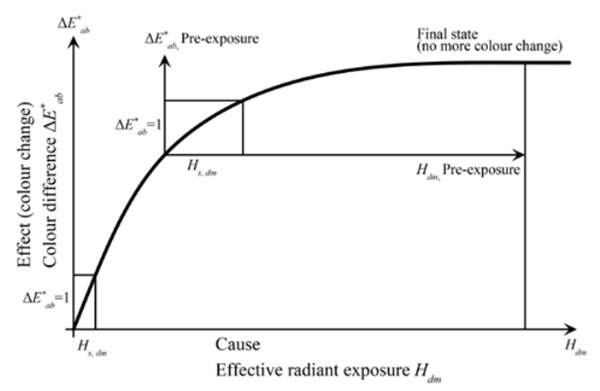
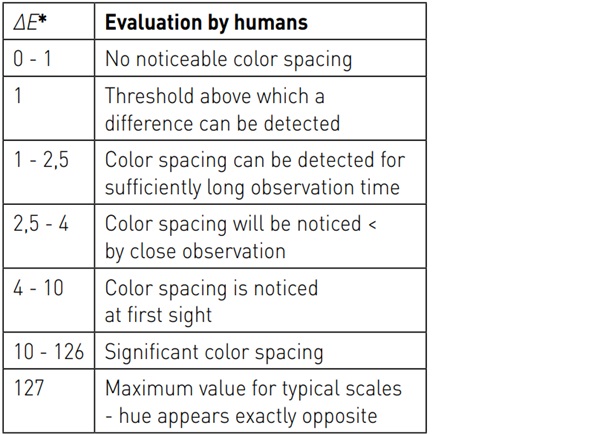
In several experimental investigations, a non-linear relationship between the color spacing and increasing harmful or effective radiation was shown. (Herzberg, H. & Völker, S., 2010) As soon as a certain input of the damaging radiation has been reached, a state of equilibrium is achieved and no further color change occurs. The threshold exposure Hs,dm is defined as follows. The effective exposure, which leads to an initial color spacing of ∆E* = 1 (Table 1) that is perceptible to the eye, is referred to as the threshold exposure (Fig. 1).
Threshold exposure is therefore considered an indicator of a material's light stability. In order to achieve a ∆E* = 1, only a very small threshold exposure is needed at the start of exposure. Pre-aged exhibits require a much higher threshold irradiation. Thus, pre-exposed samples are less sensitive to radiation. (FGL, 2006)
2.3 Damage potential depending on the wavelength
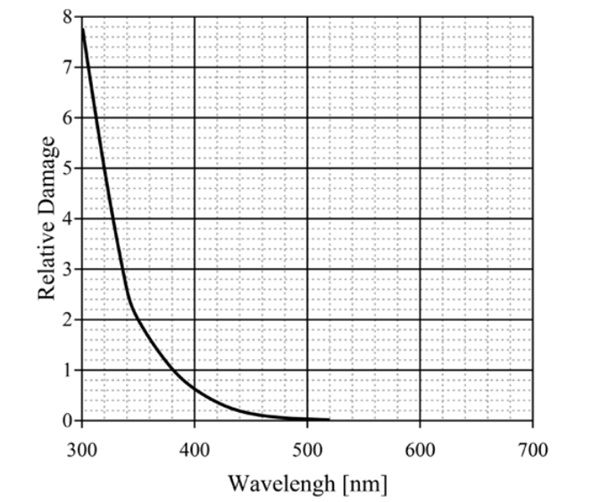
In 1953, Harrison (Harrison, L., 1953) proposed a method for evaluating the relative damage potential of different types of light sources and filter combinations (Fig. 2). This is described in a function developed by him, which represents the relative spectral sensitivity of a defined material. This index should be used to determine the damage potential of alternative light sources or filter combinations. (CIE157, 2004)
Harrison's contribution to the wider museum community was very influential. According to his damage function, damage is almost entirely due to UV-radiation. Furthermore, the relatively low level of damage from visible radiation longer than 500 nm is negligible. This stuck in the minds of many museum directors that the light bulb was deemed safe and natural light had to be removed from the galleries and museums. (CIE157, 2004)
3 Interlayer materials for laminated glass
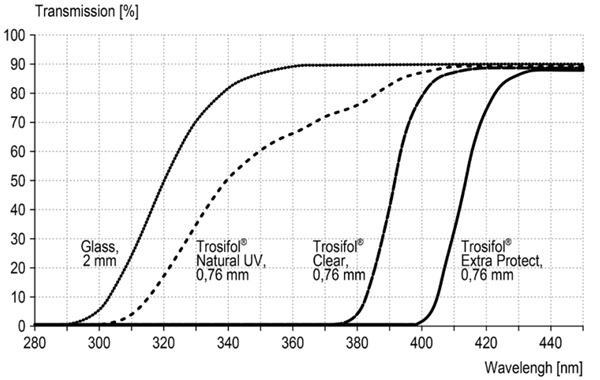
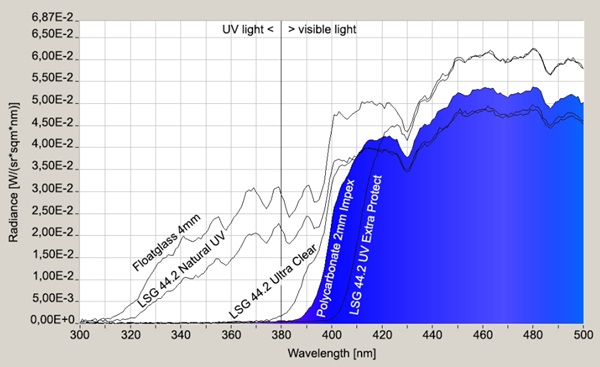
The field study described below was conducted with test specimens from LSG. The clear films from the Trosifol product range were used as interlayer films. They include films with transmission from 310 nm (Trosifol Natural UV), 380 nm (Trosifol Clear) and 400 nm (Trosifol Extra Protect), compare Fig. 3.
4 Methods for fading assessment
4.1 The CIELAB-System
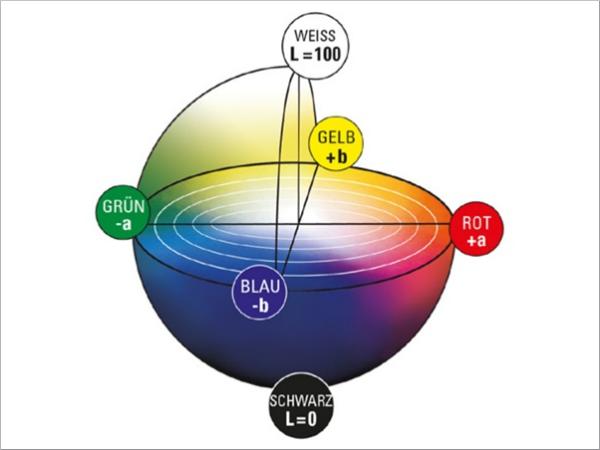
The CIELAB system created in 1976 (Welsch, N. & Liebmann, C.C., 2012) is still the most used color space when color distances have to be recorded, described, compared and expressed in numerical values. (CIE157, 2004) The CIELAB color space was derived from the CIE standard valence system introduced by the International Commission on Illumination in 1931. The CIELAB system was developed to approximate the color spacings perceived by humans. (Kittel, H., 2006) The CIELAB system is a three-dimensional spherical color space defined by three axes (Fig. 4).
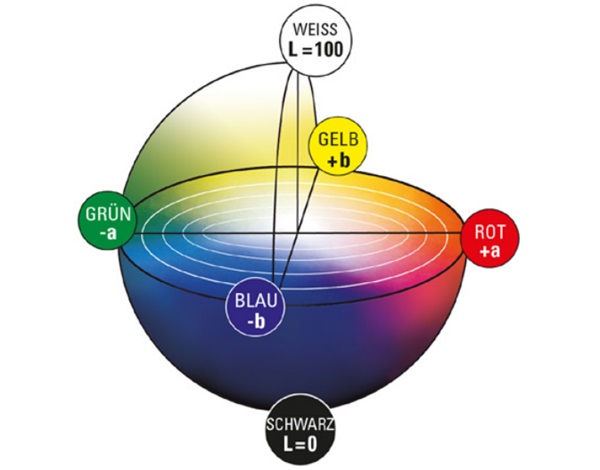
In the conventional x-y-z coordinate system, the z-axis would represent brightness. In the CIELAB system this is marked with L* and ranges from absolute black L* = 0" to absolute white L* = 100". It is defined as the only axis by a fixed start and end point. Two other axes create a chromatic plane, here denoted by a* and b*. This plane describes the saturation of the hue. The further a color location is shifted outward, the stronger the saturation becomes. If this shifts in the direction of the coordinate origin, the saturation decreases. A positive a*-value describes red, a negative value is green. Also, a positive b*-value reflects yellow tones and a negative b"*" -value reflects blue tones. (DIN EN ISO/CIE 11664-4, 2020) In the center of the whole is the achromatic point. This is where the purest gray is shown. (Eichler A., 2022) Since this point is located exactly in the center of the system, it has the coordinates P(50;0;0).
With this system, each hue can be assigned a specific point with the coordinates L*;a*;b* (DIN EN ISO/CIE 11664-4, 2020). With the respective coordinates of two color locations, the average overall color spacing ∆E*ab can be calculated as follows:
![]()
The color spacing between two color locations is illustrated in the CIELAB system by a vector ∆E*ab or ∆E*. All changes in the three dimensions are recorded and the Euclidean distance is calculated. (ISO 13655, 2009)
4.2 Standardized and non-standardized methods
Various standards describe guidelines for test methods and their evaluation with regard to the lightfastness of materials, for example for furniture in DIN EN 15187 (DIN EN 15187, 2006) or in the various versions of DIN EN ISO 105 for textiles. The standard DIN EN ISO 105-B01 (DIN EN ISO 105-B01, 2014) details the procedure for a color fastness test against daylight, which is similar in its basic concept to the project carried out here.
The most obvious effect of exposure to harmful radiation is fading. This is characterized by an increasing loss of color intensity and is easily perceived as lightening, especially in dark colors. This effect prompted researchers to categorize the damage. Thus, in 1995, the first ISO classification system was created, which is also suitable for the general classification of museum objects. This system is based on the blue wool scale. (CIE157, 2004)
For the test method described in DIN EN ISO 105-B01, lightfastness grades of blue-dyed wool are also required, from which the degree of damage from fading can be derived. The test scales produced and used in Europe are divided into levels from 1 to 8 and must meet the quality requirements of ISO 105-B08. Level 1 has the lowest and level 8 the highest color stability when exposed to light. It also applies that the respective subsequent level is approximately twice as stable to irradiation. In order to achieve this, the individual strips are colored with different degrees of fading. (DIN EN ISO 105-B01, 2014)
Repro color sample cards of the company Agfa, like other reference cards, served as color scales in the printing trade. They were produced according to the historical DIN 16508 (DIN 16508, 1967) and used for three- and fourcolor printing to test color reproduction and brightness gradation. They also specified the order in which the various colors were printed. (Kerner, H.K. & Kerner H., 2007)
5 Specimens
5.1 Color scale samples
For the investigation of the glasses, several color scales were chosen. They consist of organic and anorganic color pigments and cover typical materials in conservation application.
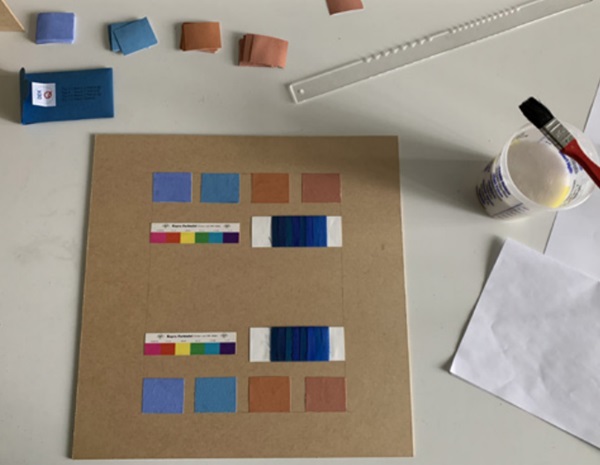
In Detail, color pigment producing company Kreidzeit “Marble Powder Casein shades” and, the organic pigments in printed (Repro color chart from Agfa according to DIN 16508 (DIN 16508, 1967) and textile (Blue Wool Standard from James Heal according to DIN EN ISO 105-B08 (DIN EN ISO 105-B08, 2010) form. An opaque, high-pigment mixture (shade A corresponding to a ratio of 1:10) was chosen, and care was taken to apply it evenly in order to create a uniform result. All sample carriers were put to a wood fiber board.
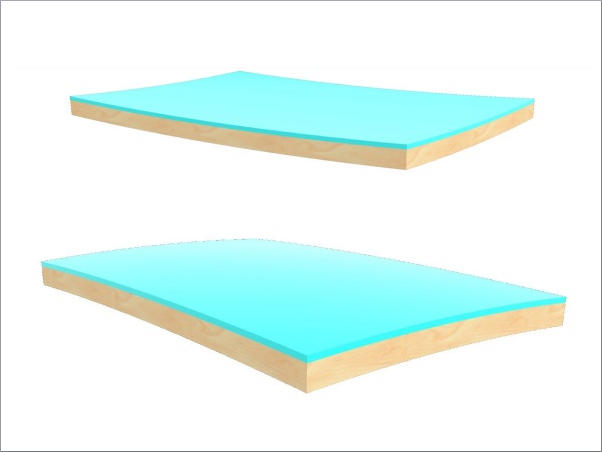
In order to make the changes caused by the temperature and humidity difference visible, the specimen slides were divided in the middle and one half was covered. The samples were each exposed to the same climatic conditions. A blank sample was kept unexposed at laboratory temperature and humidity for the entire test period. The color scale samples were glued only to the back of their support material to exclude any influence due to the change in the organic cellulose binder.
Two sample carriers were prepared for each glass type (Fig. 5).
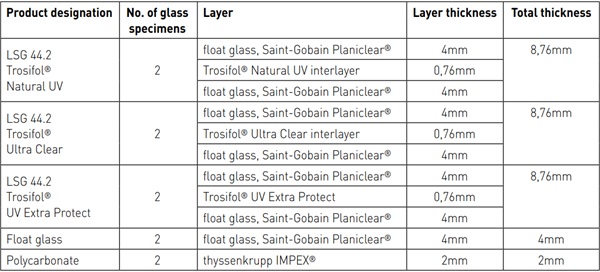
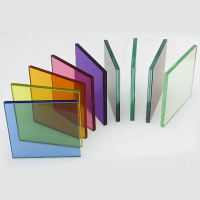
5.2 Glass specimens
The glass specimens cover the product width of LSG with transparent PVB-Interlayer and UV-blocking-function from 310 nm to 400 nm. All interlayers are produced by Kuraray. Additionally, beside the LSG also a monolithic float glass pane and a polycarbonate (acrylic glass) pane were investigated. The UV-permeable polycarbonate glass (2 mm thyssenkrupp IMPEX®, polycarbonate sheets to DIN EN ISO 11963 / DIN 16801) was intended to provide additional results of a non- or lowUV-blocking material. In the course of the test series, however, it became apparent that the supposedly UV-permeable polycarbonate glass achieved a protective effect.
The transmission behavior of all specimens was measured against a slightly cloudy sky with a Jeti spectroradiometer specbos 1211UV and is shown in the in the interesting UVrelevant wavelength between 300 nm and 500 nm (Fig. 6).
6 Testing schedule and setup
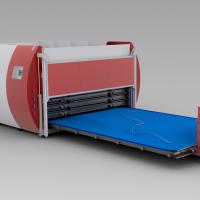
6.1 Experimental setup
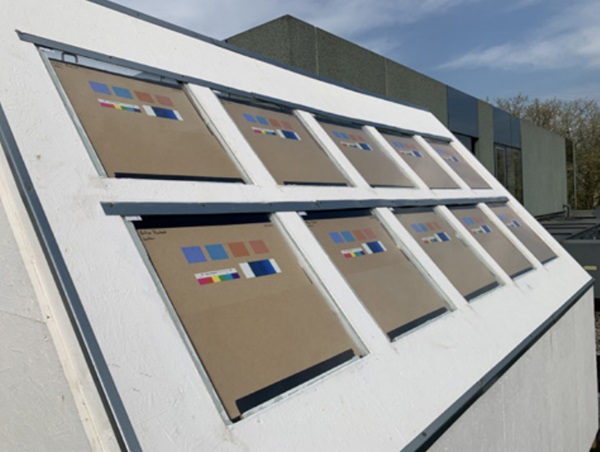
A test rig (Fig. 7) was manufactured to accommodate the glass specimens and the color scale samples. it also served as a weather protection against moisture and humidity as well as heat accumulation. In addition, the specimens should be exposed to a maximum amount of sunlight to obtain the highest possible radiation input. The procedure for testing color fastness under the influence of daylight is described in DIN EN ISO 105-B01(DIN EN ISO 105-B01, 2014), as are the requirements for the test stand.
The test rig was set up facing exactly south on an unshaded flat roof. It was also ensured that the construction of the test rig would not cast a shadow on the color scale samples over the course of the day. In order for the solar radiation to strike the samples at an angle of 90° maximum often, the samples and glasses must have an angle to the horizontal that corresponds to the approximate latitude of the installation site, which for the Dessau site is about 51° to the horizontal.
Ventilation of the interior to prevent heat accumulation was ensured by weatherprotected air supply and exhaust openings. Effective air circulation is achieved via the resulting chimney effect. To reduce heating of the trainer by radiation absorption, a white paint coating was applied. A rough fleece was applied to the inside of the trainer to minimize reflections and associated light scattering onto the paint scale patterns. (DIN EN ISO 105-B01, 2014)
6.2 Experiments
The tests were carried out from 05 May 2021 to 06 Nov 2021 and lasted 148 days. At the beginning of the experimental period, daily measurements were performed due to the expected rapid changes in color distances. As the irradiation progressed, the intervals were increased to 7 days and finally to 14 days.
All measurements were performed in a darkroom to avoid additional damaging radiation outside the experimental setup. The SpectroDens from TECHKON was used for the measurements, a spectral densitometer that feeds the measured data directly into a prepared Excel spreadsheet. Since the ink application is not exactly the same at every point, incorrect measurements can also occur here. To prevent this, a measuring point network was created and a corresponding measuring point rail was made. In this way, the same point could always be recorded and measured. Two measuring points were assigned to each specimen. The two recorded measured values of the respective sample were then averaged.
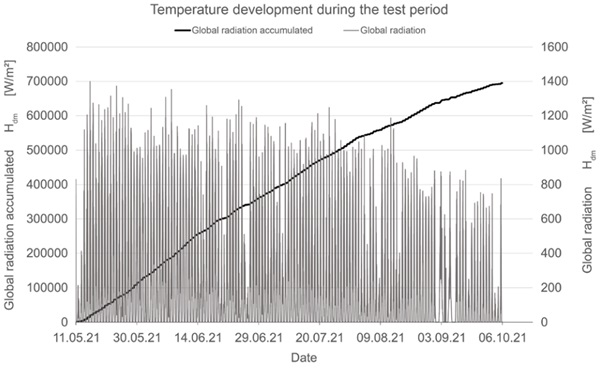
In this field test, 10 test specimens were measured, each with 36 specimens to be processed individually. In total 16,000 measured values were determined, additionally the global radiation, humidity and temperature inside and outside the test rig were recorded permanently (Fig. 8).
7 Results
7.1 Visual observation of the samples
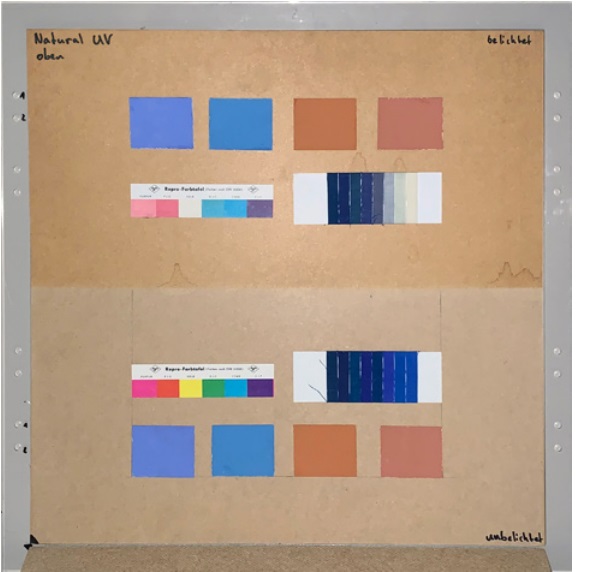
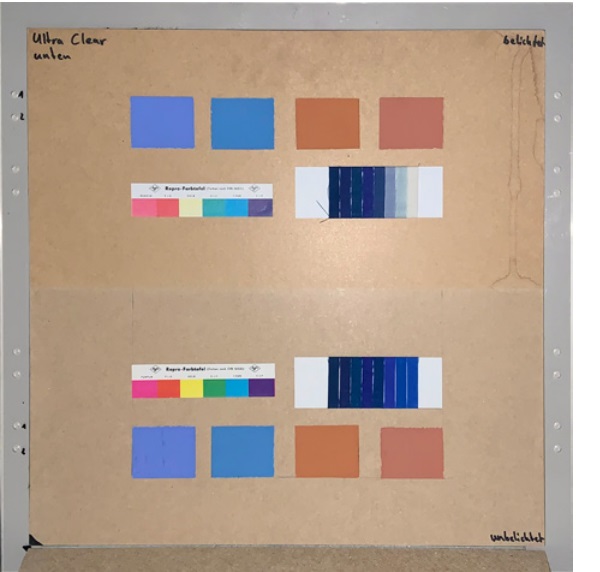
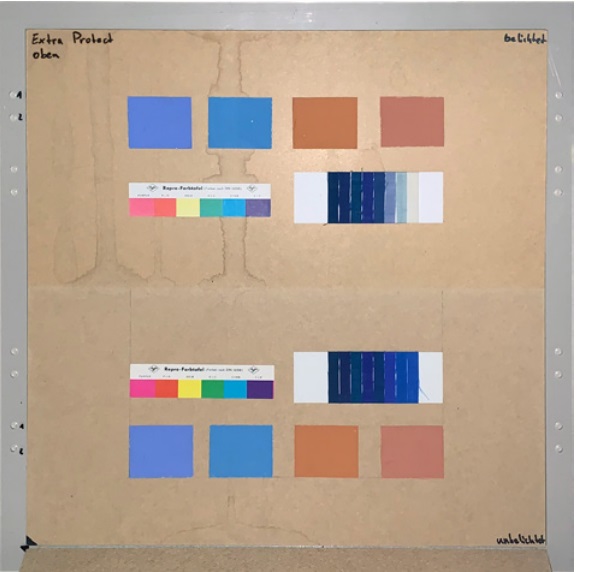
The measurements were carried out over a period of 20 weeks in summer 2021. As described above, all series of measurements were performed on two test specimens of the respective glasses. Fig. 9 to Fig. 11 show sample carriers of a few glass type. The upper side was sun exposed for 12 weeks, the lower side unexposed as reference color.
The visual inspection shows fading of the color samples for all glass types, but the intensity depends on the particular color sample and on the glass type. Both test specimens of each glass structure show the same fading behavior of the color samples.
7.2 Measured color values of the samples
Based on the total number of 16,000 measured values, the fading behavior of the color samples is described in tables and diagrams. From the large number of color samples, three groups can be identified, namely samples from non-stable, medium-stable and very stable color pigments.
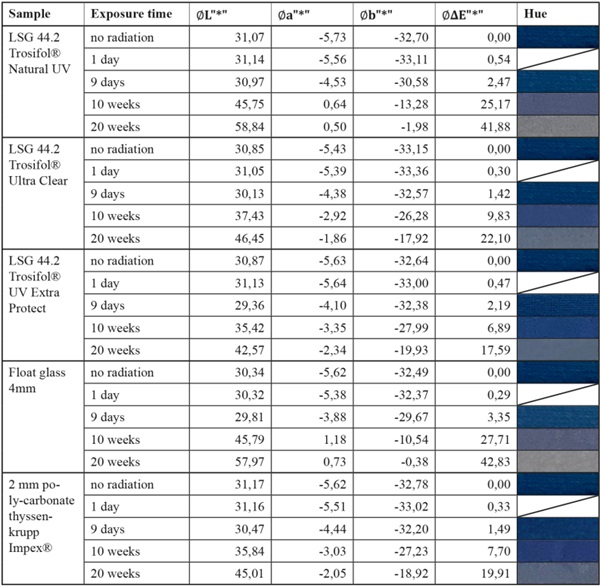
Figure 12 shows as example the measured changes of the colorants in numerical values of a representative color sample of moderately stable color pigments. In the following, the measured changes of the dyes are presented in numerical values. As an example, the effects of the individual axes of the color space on the color difference can be compared. The numerical values shown are in each case the averaged measurement results of measurement point 1 and measurement point 2 of the first sample carrier, which is located at the top in the test arrangement here. For visual comparison, the photographically documented color nuances are shown in the last column.
8 Discussion of results
8.1 Color fading protection
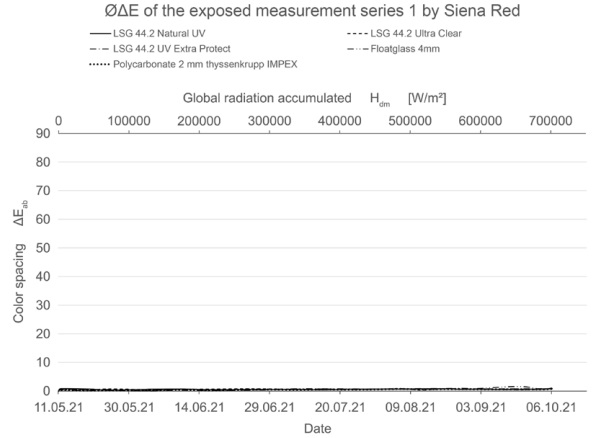
Fig. 13 to Fig. 15 show the color spacing values from the tables graphically for the three identified groups of non-stable, medium-stable and very stable color pigments.
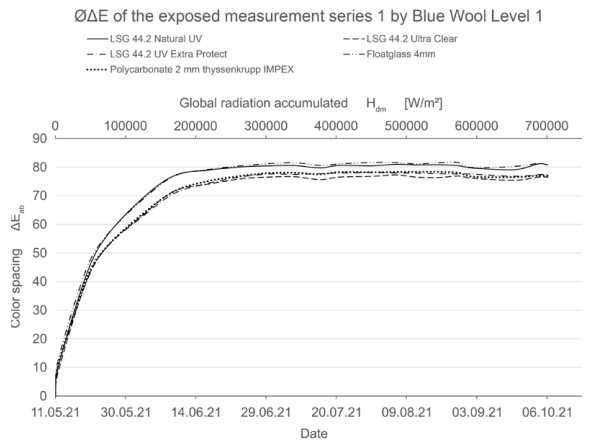
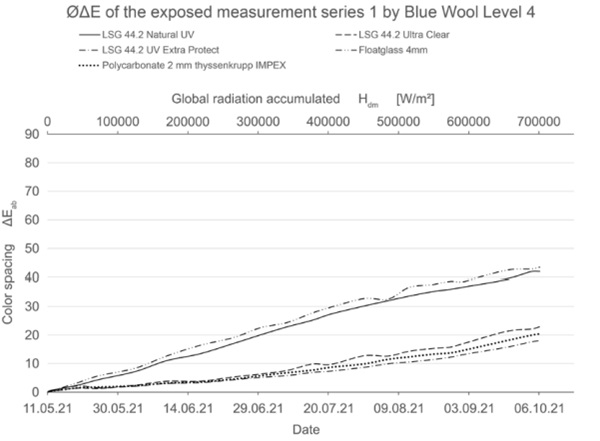
These diagrams show by means of the color spacing ∆E* the time-dependent fading development. Depending on the color pigment and radiation, the color spacing ∆E* plateaus after a certain period of time at about ∆E*~ 80 to 90 (Fig. ). The size of the increase of the color spacing ∆E^* shows how stable the color pigments are against radiation.
If the fading progresses rapidly, the curve is steeper and has reached its maximum earlier. For very stable materials, it is flat or with a slight slope. For some moderately stable materials, the plateau has not yet been reached within the 20-week test period (Fig. 14).
The tested mineral pigments from color producer "Kreidezeit" confirm the expected high resistance to solar radiation. All samples show very little or no change (Fig. ). Compared to the blank sample, the authors estimate that this is due to other aging processes, especially in the case of the blue pigments.
The basic colors of the company Agfa repro ink, i.e. violet, yellow and cyan, behaved very differently in the test. Yellow proved to be unstable, violet moderately stable, and cyan very stable. It can also be seen that the mixed colors tend to follow the more unstable hue in their damage progression. Only in the case of violet did mixing behavior occur. It should also be noted that glasses with improved UV protection were able to achieve higher color fastnesses in the very sensitive samples, as expected.
The blue wool standard performed largely as expected over the test period. Level 8, which has the highest color fastness, was barely or not at all affected by irradiation for all test samples. Between levels 7 and 4, there is a progression where the materials become increasingly sensitive. In this range, significantly less fading is achieved by lenses with high UV protection. In particular, VGS with Trosifol UV Extra Protect stands out at levels 5 and 6 compared to VSG with Trosifol Ultra Clear.
In this middle range, the blue wool samples show a clearly visible increase in fading under glasses with Trosifol Extra Protect via Ultra Clear to Natural UV.
From level 3, however, the samples faded very quickly and almost equally among all test specimens up to a certain plateau, with no further progression beyond this. It is possible that increased summer temperature has a noticeable effect on fading in these sensitive blue wool samples level 1 to 3. This needs to be investigated further.
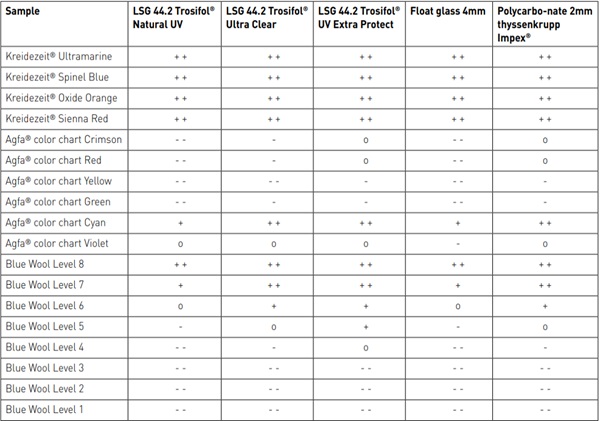
Table 3 shows an overview of the color samples examined with regard to their fading behavior based on the color spacing ∆E* that occurred using a qualitative 5-level scale. In the group of medium-stable color pigment the use of LSG with high UV-blocking interlayer like Trosifol Extra Protect provide the most significant fading resistance compared to the other LSGproducts.
In the case of non-stable or low-stable color pigments, strong fading occurs within a short time in all glasses. The medium-stable color pigments show the greatest influence of the different glazing within the test period of 20 weeks. In the case of the very stable color pigments, no or only slight changes in the color difference could be detected during the test period and thus the protective effect of the different glazing could not be clearly distinguished. It can be assumed, however, that prolonged exposure to radiation will result in similar behavior to the medium-stability color pigments, with visibly reduced bleaching of the samples under laminated safety glass with films of high UV protection.
8.2 Effect of a color shift
Besides the fading of the color pigments, there is the effect of color shifting.
This effect is particularly pronounced with mixed colors and is explained using the color example Agfa Repro Green. The color Repro Green consists of two primary colors, Repro Yellow and Repro Cyan, in approximately equal parts. Upon exposure to radiation, the mixed color shifts from green to blue. This is due to the fading of Repro Yellow. The pigments of the yellow hue are destroyed and the stable blue pigments remain.
In the underlying scientific paper (Mueller et.al., 2023) the color shift effect is explained in detail.
9 Acknowledgements
The authors would like to thank Kuraray Company for providing the required materials, samples and specimens.
10 References
CIE157 :2004. (2004). Control of damage to museum objects by optical radiation, Wien: CIE (Commission Internationale de l’Eclairage) Central Bureau.
DIN 16508:1967-12. (1967). Farbskala für den Buchdruck, außerhalb der europäischen Farbskala - Normdruckfarben und Druckreihenfolge. Berlin: Beuth Verlag.
DIN EN 15187 :2006-12. (2006). Möbel - Bestimmung der Lichtbeständigkeit von Oberflächen. Berlin: Beuth Verlag.
DIN EN ISO 105-B01 :2014-12. (2014). Textilien - Farbechtheitsprüfungen - Teil B02: Farbechtheit gegen Licht: Tageslicht. Berlin: Beuth Verlag.
DIN EN ISO 105-B08 :2010-02. (2010). Textilien - Farbechtheitsprüfungen - Teil B08: Überprüfung der blauen Lichtechtheitstypen aus Wollgewebe 1 bis 7. Berlin: Beuth Verlag.
DIN EN ISO/CIE 11664-4:2020-03. (2020). Farbmetrik - Teil 4: CIE 1976 L*a*b* Farbraum. Berlin: Beuth Verlag.
Eichler A. (2022). Farbabstände in der industriellen Farbmessung [Online].: https://www.coates.de/
Feneis, C.V. (2020). Entwicklung und exemplarische Anwendung einer Methodik zur Untersuchung der schädigenden Wirkung von optischer Strahlung an mineralischen Buntpigmenten in Bindemittelmatrizen. Ph.D.-Thesis. Martin-LutherUniversity Halle-Wittenberg. FGL (Fördergemeinschaft Gutes Licht). (2006).
Museumsbeleuchtung: Strahlung und ihr Schädigungspotenzial. Frankfurt am Main.
Harrison, L.S. (1953). Report on the deteriorating effects of modern light sources. Metropolitan Museum of Art, New York.
Herzberg, H. (2014). Konzeption und Aufbau eines Monitoringsystems zur Vermeidung von Schädigungen durch optische Strahlung an Sammlungsgut. Ph.D.-Thesis. Faculty IV - Electrical Engineering and Computer Science, Technische Universität Berlin.
Herzberg, H. & Völker, S. (2010). Sensor zur direkten Erfassung objektschädigender Strahlung - Entwicklung eines neuen Messsystems, Restauro Nr. 7/10.
ISO 13655:2009-12. (2009). Graphische Technik - Spektrale Messung und farbmetrische Berechnung für graphische Objekte. Berlin: Beuth Verlag.
Kerner, H.K. & Kerner H. (2007). Lexikon der Reprotechnik – zweite erweiterte Auflage. Mannheim: Reinhard Welz Vermittler Verlag.
Kittel, H. (2006). Lehrbuch der Lacke und Beschichtungen Band 10 - Analysen und Prüfungen. Stuttgart: S. Hirzel Verlag.
Koesling, V. (2000). Vom Feuerstein zum Bakelit: Historische Werkstoffe verstehen (Bd. 5/6). Stuttgart: Theiss.
Krochmann, J. (1987). Beleuchtung von lichtempfindlichen Ausstellungsstücken unter besonderer Berücksichtigung der Objektschädigung durch optische Strahlung. Fraunhofer IRB Verlag.
Löther, T. (2021). Was leisten Lichtschutzsysteme in der Praxis? Verschiedene Lösungsansätze und Ergebnisse im Langzeittest. VDR Beiträge - zur Erhaltung von Kunst- und Kulturgut, Nr. 1/2021. pp. 39-51. Bonn: Michael Imhof Verlag.
Müller, M.; Reich, S.; Pfuetze, C.; Stelzer, I. (2023). Investigation of color protection of laminated glass by UV-blocking interlayers for conservation application. In: Glass Structures & Engineering, 2023, manuscript in review.
Naumović, T. (2021). Lichtschutzkonzepte in der Bayerischen Schlösserverwaltung - Ein Praxisbericht. VDR Beiträge – zur Erhaltung von Kunst- und Kulturgut, Nr. 1/2021. pp. 88-97. Bonn: Michael Imhof Verlag.
Schaeffer, T.T. (2001). Effects of Light on Materials in Collections - Data on Photoflash and Related Sources. The Getty Conservation Institute - The J. Paul Getty Trust. Los Angeles.
Sharma, G., Wu, W. & Dalal, E.N. (2005). The CIEDE2000 Color-Difference Formula: Implementation Notes, Supplementary Test Data, and Mathematical Observations. 02/2005 [Online]. http://www2.ece.rochester.edu/~gsharma/ciede2000/.
Trosifol (2020). Architectural product portfolio for laminated glass. 12/2020 [Online]. https://www.trosifol.com.
Welsch, N. & Liebmann, C.C. (2012). Farben - Natur, Technik, Kunst. Heidelberg: Spektrum Akademischer Verlag.